OptiNod Academy
Ichimoku — Why Flat Lines Become Price Centers
Three of the five lines trace the high-low midpoint, not closing-price averages, so they flatten in a range and that level becomes the center price keeps returning to.
Start with what each of the five lines is
Ichimoku Kinko Hyo plots five lines on the chart. The names are unfamiliar and each is calculated differently, so it looks complicated at first, but taken one line at a time it is simple.
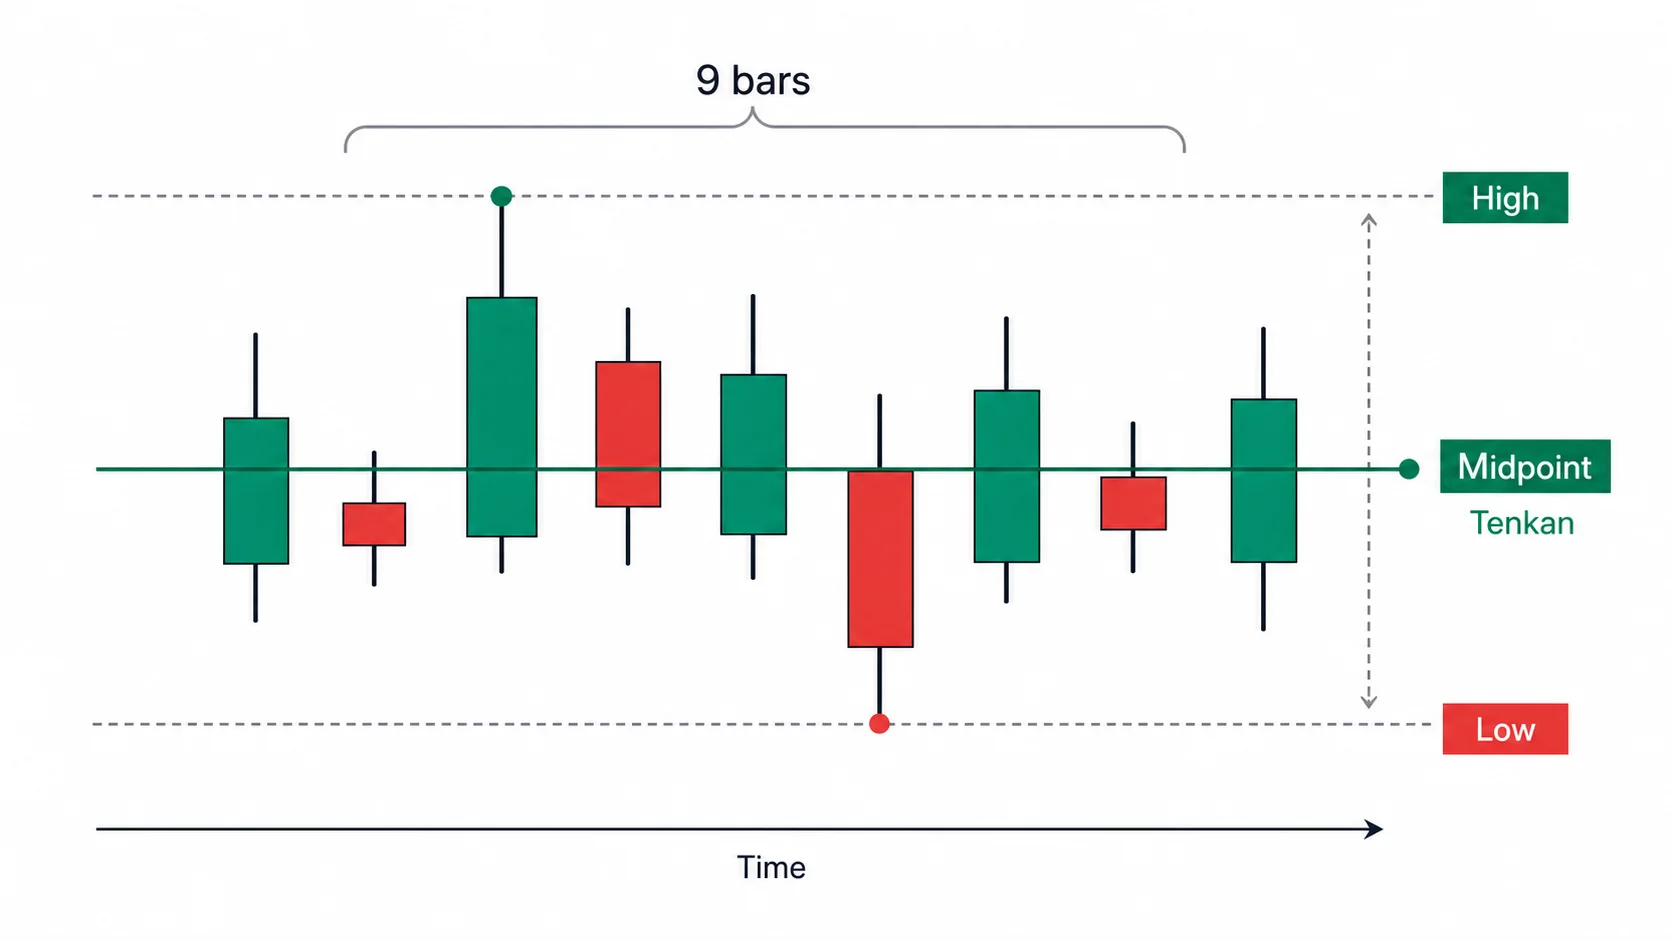
Conversion Line (Tenkan-sen, 転換線). This is the highest high and the lowest low of the last 9 bars, added together and divided by 2. If the highest high over those 9 bars is 100 and the lowest low is 90, the Conversion Line is 95. Its lookback is short, so it follows price quickly and shows whether the short-term move is up or down. It is called the Conversion Line because it marks the spot where the short-term direction turns.
Base Line (Kijun-sen, 基準線). This is computed exactly like the Conversion Line, only with a longer lookback of 26 bars. Because the period is longer, it moves more slowly than the Conversion Line and anchors the center of the medium-term move. When price is above the Base Line, the medium-term move is up; when it is below, the move is down. A Base Line that slopes up means the medium-term move is rising, one that slopes down means it is falling, and a flat one means there is no direction. It is called the Base Line because it serves as the baseline of the trend, and it is the line you watch most in Ichimoku.
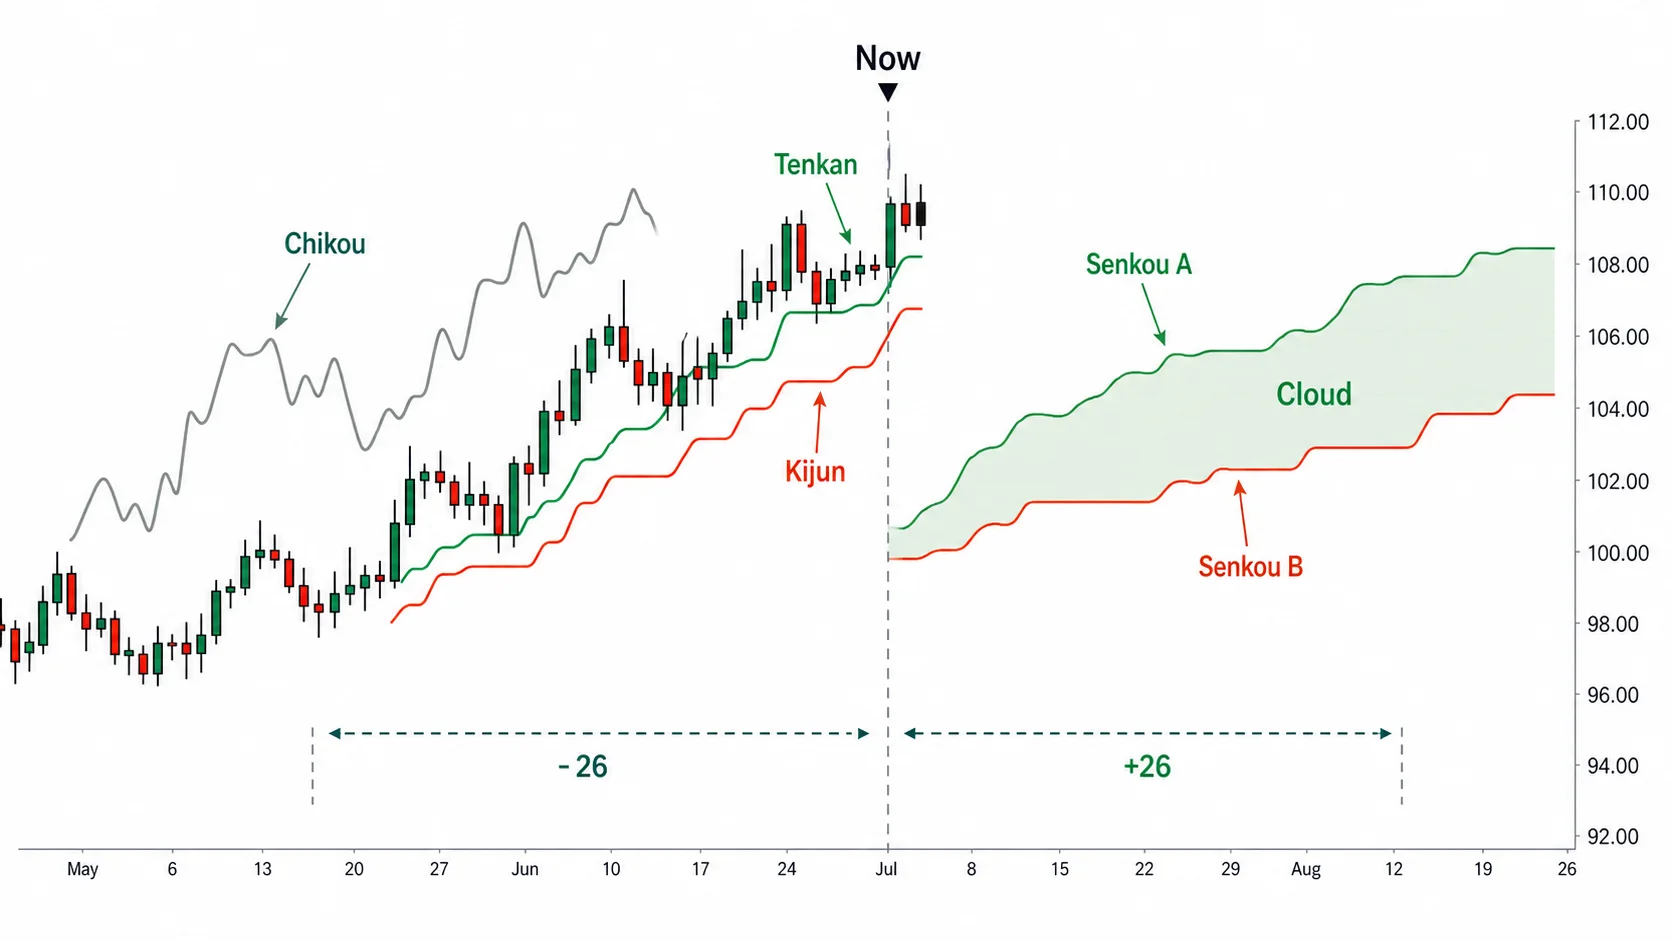
Leading Span A (Senkō Span 1, 先行スパン1). This is the Conversion Line and the Base Line added together and divided by 2. It averages the short-term center and the medium-term center one more time. Unlike the other four lines, this value is not placed at the current spot but shifted 26 bars to the right. Exactly how many columns ahead it sits varies by one depending on how the bars are counted, which Part 2 covers separately.
Leading Span B (Senkō Span 2, 先行スパン2). This is the highest high and the lowest low of the last 52 bars, added together and divided by 2. It has the longest lookback of the five lines, so it moves the slowest and represents the center of the long-term move. Like Leading Span A, it is drawn shifted 26 bars ahead.
Lagging Span (Chikou Span, 遅行スパン). It is built differently from the other four lines. It does not take the midpoint of the high and the low; it takes today's closing price as is and plots it 26 bars to the left. Placing today's close at the spot 26 bars ago shows at a glance whether current price is above or below where it was then. Why the Lagging Span is the most important of the five lines is the subject of Part 3.
The band filling the space between Leading Span A and Leading Span B is the cloud (Kumo). Because both lines are drawn shifted ahead, the cloud sits ahead of price too. The cloud floating above current price was calculated from past values and shifted forward, and it shows in advance the support and resistance zones price will meet as it moves on. The Conversion Line and the Base Line overlap current price at the same spot; the Leading Spans and the cloud are drawn ahead of where price has reached. The thickness and shape of the cloud are covered in Parts 2 and 4.
The Conversion Line, the Base Line, and Leading Span B are computed the same way, differing only in their lookback of 9, 26, and 52 bars. Placed together, the short-, medium-, and long-term centers come into view at a glance. When the three lines line up neatly in one direction, the centers of all three time frames point the same way; when they are tangled together, the direction is not yet set.
The three lines are computed from highs and lows alone
The three lines — the Conversion Line, the Base Line, and Leading Span B — are built differently from the moving averages in common use. A moving average sums all the closing prices over a fixed period and divides by the number of bars. The three Ichimoku lines do not sum the closes; they add only two values, the period's highest high and lowest low, and divide by 2.
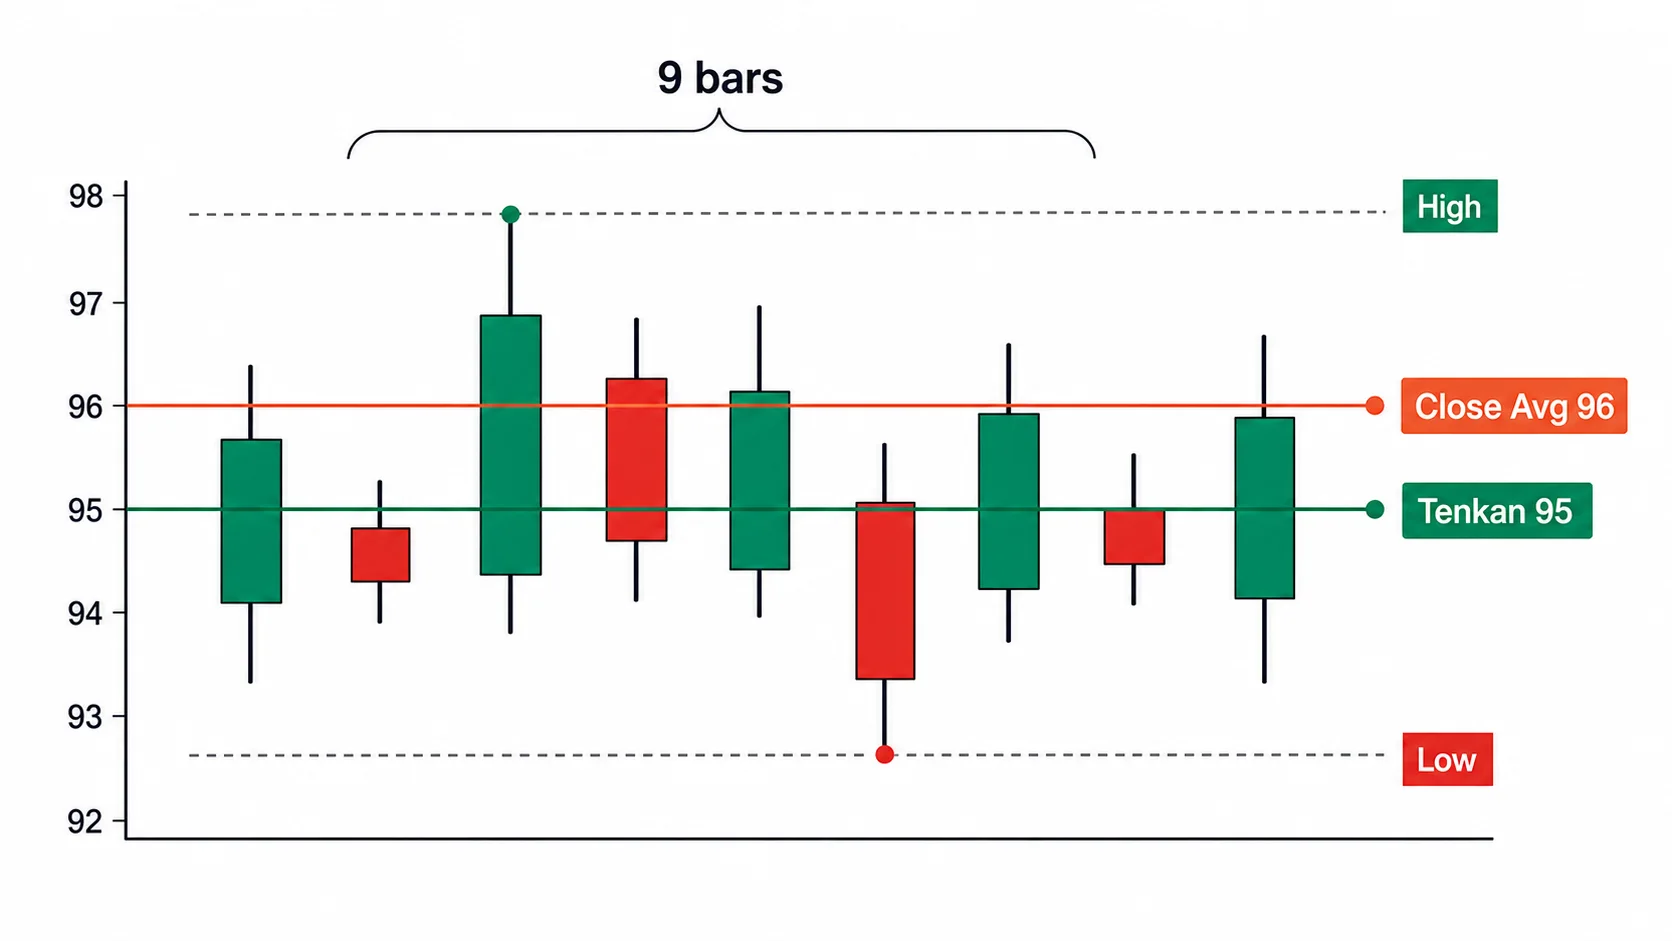
The difference is clear in numbers. If the closing-price average of some 9 bars is 96 while the highest high over those same 9 bars is 100 and the lowest low is 90, the Conversion Line is 95. The moving average reflects where within the range the 9 closes clustered; the Conversion Line looks only at the two endpoints, the top and the bottom of the range. So wherever within the range the closes gather, the Conversion Line value stays the same.
Goichi Hosoda chose the midpoint of the high and the low over the closing-price average for the sake of balance. Buyers push price up to make a high; sellers press it down to make a low. The midpoint between that high and that low is where both forces met and came to rest over the range — the balance value. A closing-price average reflects every price that traded in the range, but the midpoint of the high and the low fixes the center from only the upper and lower ends the range reached.
There is also the historical context. In the era when Hosoda created Ichimoku Kinko Hyo there were no computers, so all five lines were calculated and drawn by hand. Adding the highest high and the lowest low and halving them is far faster by hand than summing all the closes over the period and dividing. The idea of a balance value and the convenience of calculation both pointed to the same method.
Without a new high or low, the line stalls
A moving average takes in a new close every bar and drops the oldest close. So wherever price goes, the value is recomputed every bar and shifts constantly, little by little. Even in a range that rises and falls within a narrow band, the moving average moves along with the changing closes.
The three Ichimoku lines do not. The Conversion Line looks only at the highest high and the lowest low over 9 bars. If no higher high and no lower low appear within those 9 bars, the two values stay the same as bars pass, so the Conversion Line stalls at the same spot and flattens. The moment a higher high appears, the highest high used in the calculation switches to that value and the Conversion Line steps up a notch; when a lower low appears, it steps down. The Base Line at 26 bars and Leading Span B at 52 bars stay flat more often and for longer.
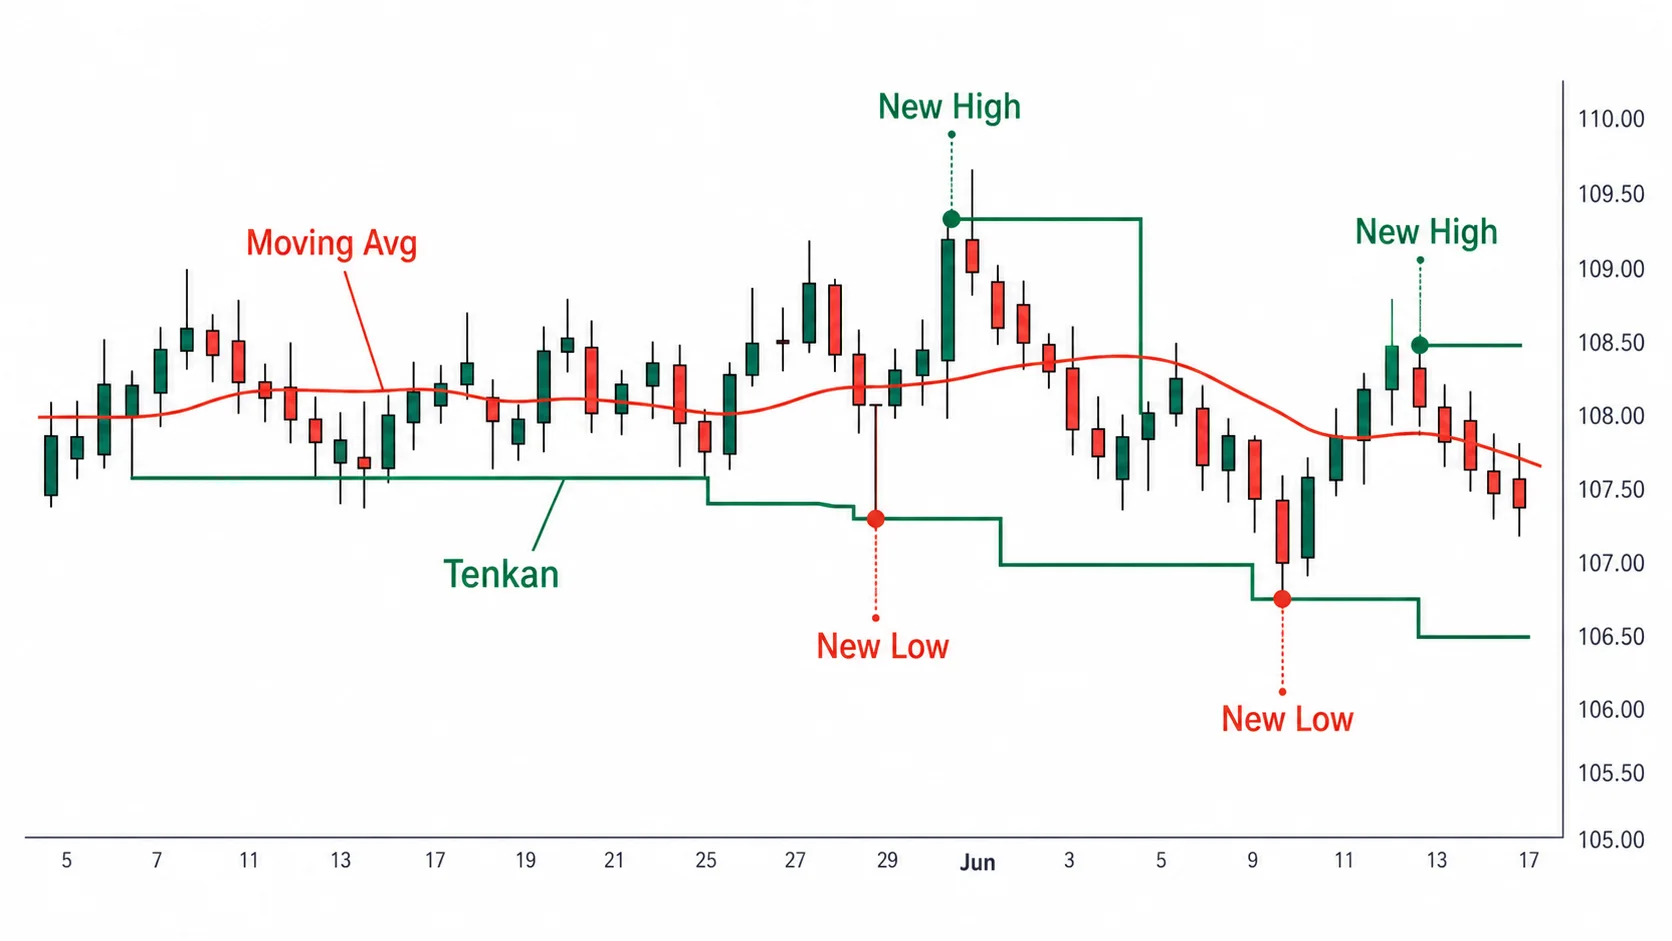
A flat Conversion Line or Base Line means that over that range price extended neither its high nor its low and traded sideways. A moving average keeps moving even during a range and shows this poorly, but the three Ichimoku lines show it with a single flat shape.
A flat line is the center price returns to
When the Conversion Line or the Base Line stays flat for a while, the line's price is the midpoint of the high and the low of that range. This happens because the high and the low have not changed and the line has stalled. In such a range, price goes up and down but often returns to this midpoint.
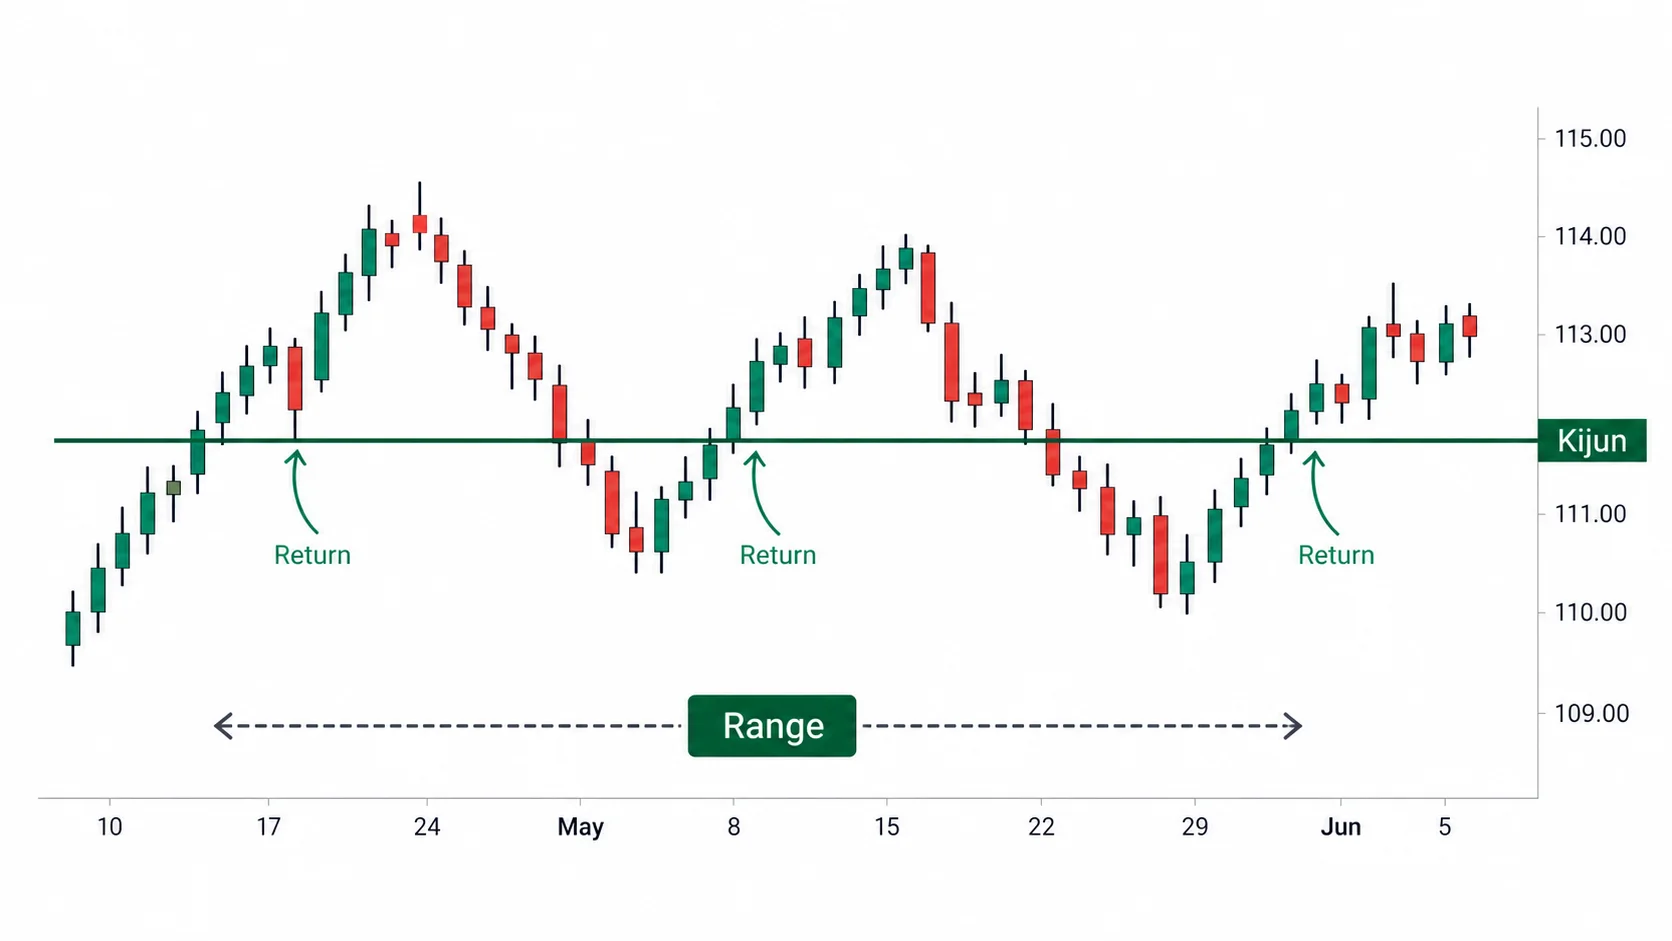
So a flat Base Line becomes the trading reference in a range. When price is pressed down from above the Base Line and falls to it, that is a buy spot where price is likely to turn back up; when price rises from below the Base Line and touches it, that is a sell spot. This reading holds only while the line is flat.
Once price clears the Base Line on a closing basis, it has committed to a direction, and this spot is no longer worth watching. A flat Base Line beginning to slope again is the same signal.
A sloping Base Line is a level that supports
If a flat Base Line is the center of a range, a Base Line tilted upward is a level that supports price within a rising move. As price climbs and then gets pressed down, it often falls to the upward-sloping Base Line and rises again.
Here the Base Line is not stalled but climbing at a slant, so the supporting level rises a little with each bar too. A downward-sloping Base Line presses price down in a falling move the same way.
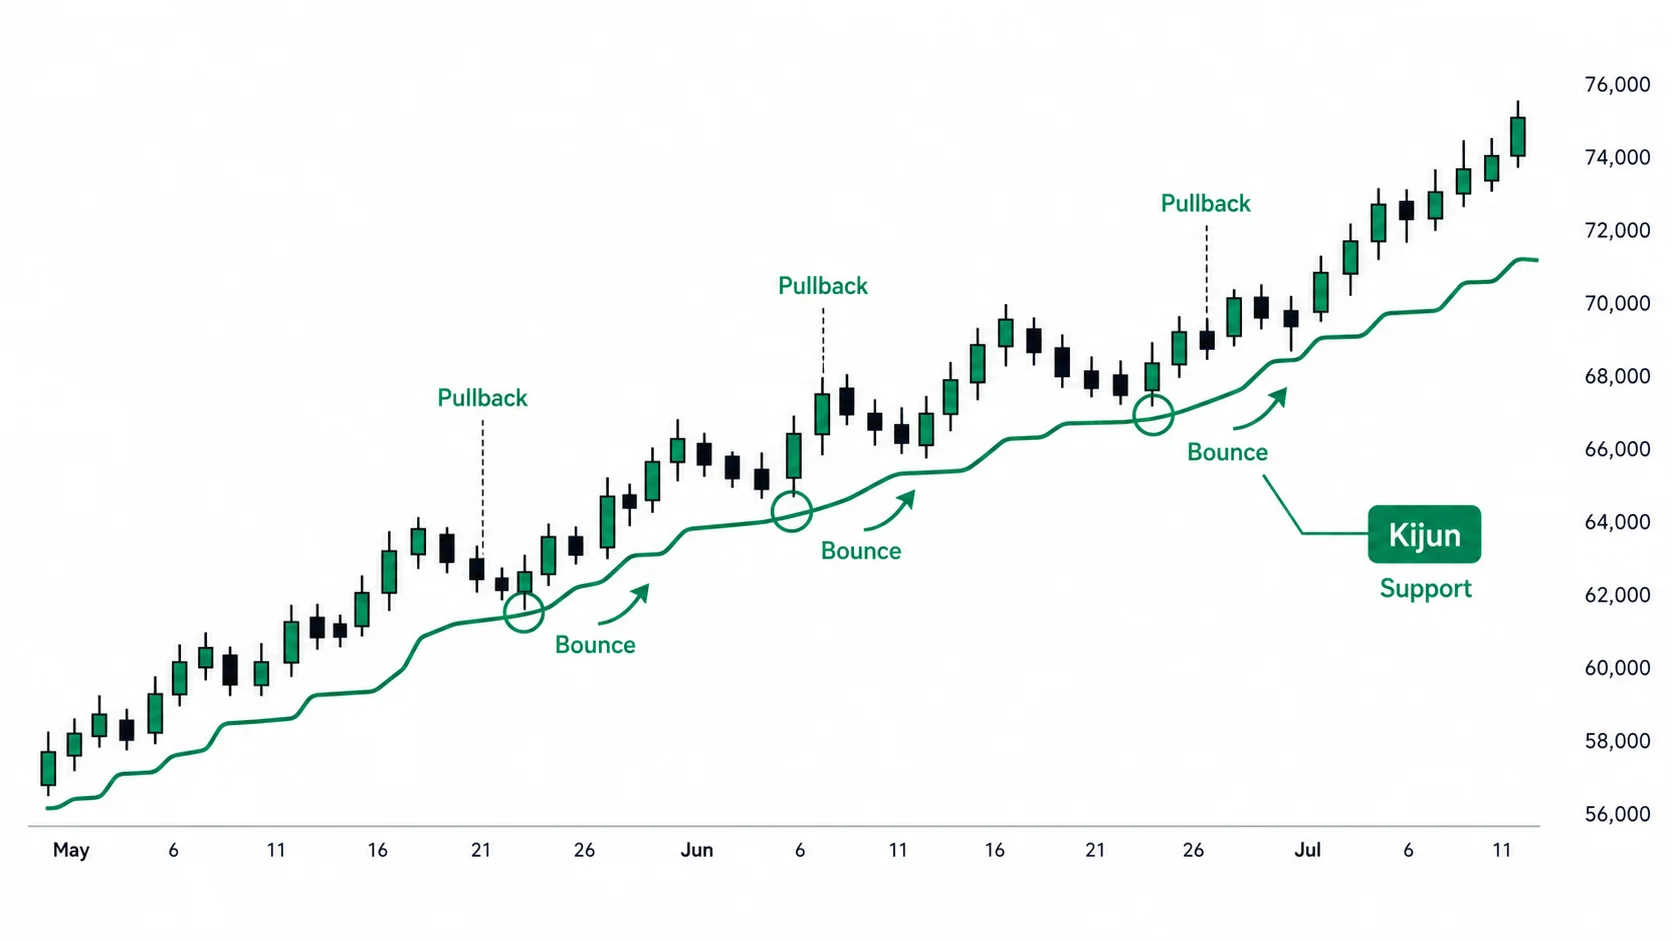
When price breaks through the Base Line on a closing basis and settles on the other side, the move has reversed.
For a one-page overview of the five lines and the cloud, see Ichimoku Kinko Hyo: an overview.