OptiNod Academy
Ichimoku — 9·17·26 Change Days
The pillar Hosoda placed ahead of price: count bars in 9·17·26 from an origin to mark change-day candidates, then accept wave or price signals only within ±1–2 bars.
Read time before price
Ichimoku Kinko Hyo rests on three pillars: wave theory, price-target theory (Nehaba Kansoku), and time theory. Wave theory looks at the shape in which price rises and falls; price-target theory pins down how far that movement will reach, setting a target price zone. Both deal with price.
Goichi Hosoda placed time theory first among the three. He saw time as the force that drives the market. Before asking what the price is, he asked how many days had passed since a given move began. Before asking at what level it would stop, he counted which day a reversal was most likely.
Hosoda divided the market into assumption (yosō) and prediction (yosoku). An assumption is a belief that things will turn out a certain way; a prediction is a level measured in advance, and when it misses, you revise the logic and measure again. Time theory belongs to prediction. You count bars from an origin point to measure a change day in advance, and when the market behaves differently at that spot, you reset the origin and the numbers.
In Part 3 we called the Lagging Span (Chikou) the single most important of the five lines. That claim sits on a different level from calling time theory first among the three theories. The Lagging Span ranks within the five lines drawn on the chart; time theory ranks within the three theories of wave, level, and time. Hosoda named both as most important himself, but the two claims point at different things.
To someone who looks only at price, time theory feels unfamiliar. When you open a chart, the first thing your eye lands on is price, and support and resistance are drawn in price as well. Time theory reverses that order: before looking at price, you count how many bars have passed since the origin point.
17 and 26 come out of 9
Time theory rests on three numbers: 9, 17, and 26. Hosoda called these the basic numbers and saw them as the bar counts at which one segment of a move tends to end.
Nine is the smallest single segment; a move that begins tends to find its first knot at the ninth bar. Both 17 and 26 come out of this 9.
The 17 comes from joining the 9 twice. Adding two nine-bar segments plainly gives 18, but when two segments join, the bar where they meet overlaps on both sides. The end bar of the first segment and the start bar of the second are the same bar. Subtracting that one overlapping bar gives 9×2−1=17. The 26 comes from joining one more 9 onto the 17. Since 17+9=26, this gives 9×3−1=26.
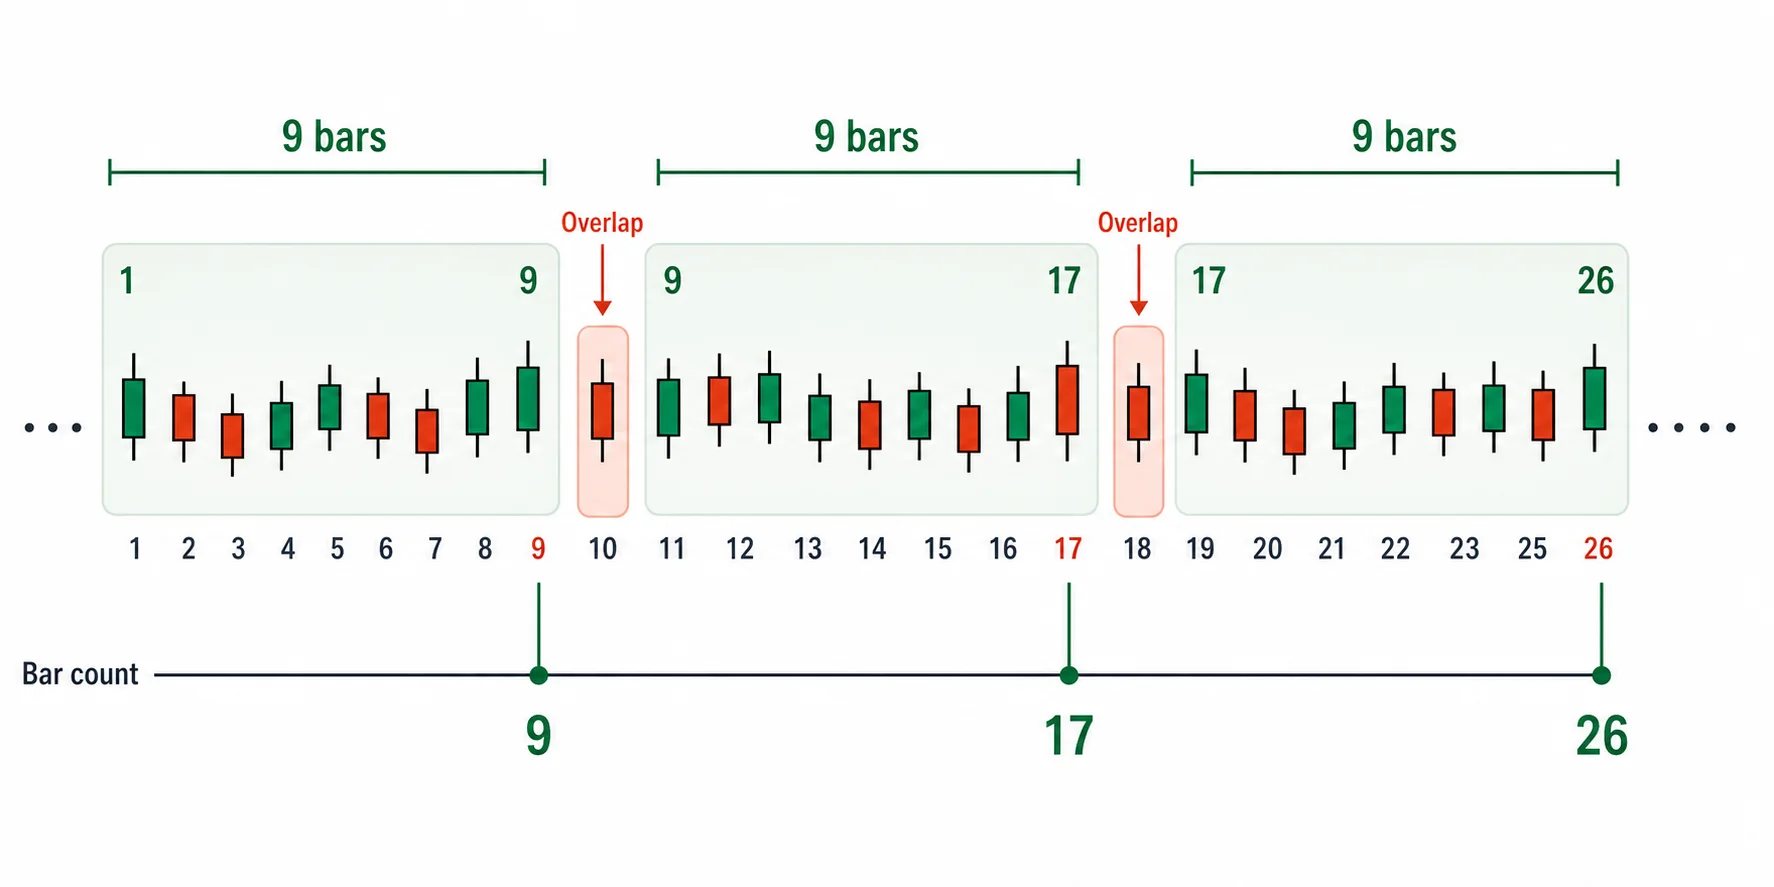
One point needs to be clear here. The line periods 9·26·52 from Part 1 and the time-theory basic numbers 9·17·26 here are two different systems. Both contain a 9 and a 26, but the line period 52 and the time-theory 17 do not occupy the same place. The line periods are the bar counts used to compute the Conversion Line (Tenkan-sen), the Base Line (Kijun-sen), and Leading Span B; the time-theory basic numbers are the bar counts used to count change days. The fact that 9 and 26 appear in both does not mean the two systems should be lumped together and used as one.
The explanation that 26 is one month
The basic number 26 is often explained as one month. In the era when Hosoda built Ichimoku, markets traded on Saturdays too, six days a week, so a month came to about twenty-six trading days. That is why the explanation that 26 bars equals one month is so widespread.
This explanation holds up well for the line periods 9·26·52, since 9 bars works out to a week and a half, 26 bars to a month, and 52 bars to two months. The orthodox interpretation, however, rejects the reading that the time-theory basic number 26 comes from the calendar. It treats the basic numbers as numbers obtained by joining segments repeatedly. The 26 is the number obtained by joining a 9 onto the 17, and that derivation has nothing to do with the calendar.
The two explanations may look contradictory, but they sort out simply. Reading the line periods as a week, a month, and two months is fine. The time-theory basic numbers 9·17·26 are treated as numbers obtained by joining segments and subtracting the overlaps, and the calendar stays out of them. That is why no one changes the 26 to a number like 22 on the grounds that trading days have decreased. The basic numbers are fixed values that come from segment derivation, not values to be adjusted to match a count of trading days.
The numbers grow above 9·17·26
The basic numbers do not stop at 9·17·26. Larger numbers follow under the same rule. Hosoda gave them names and arranged them into tiers.
The 9 is one section (一節), the 17 is two sections (二節), and the 26 is three sections (三節), with three sections also called one period (一期). When one period ends, a larger segment follows above it. The 76 is one cycle (一巡), the 226 is one round (一環), and the 676 is one full cycle (一巡環). These larger numbers are built the same way. The 76 is the number left after joining the 26 three times and subtracting the overlaps: 26×3−2=76. The 226 is the 76 joined three times: 76×3−2=226. The 676 is the 226 joined three times: 226×3−2=676.
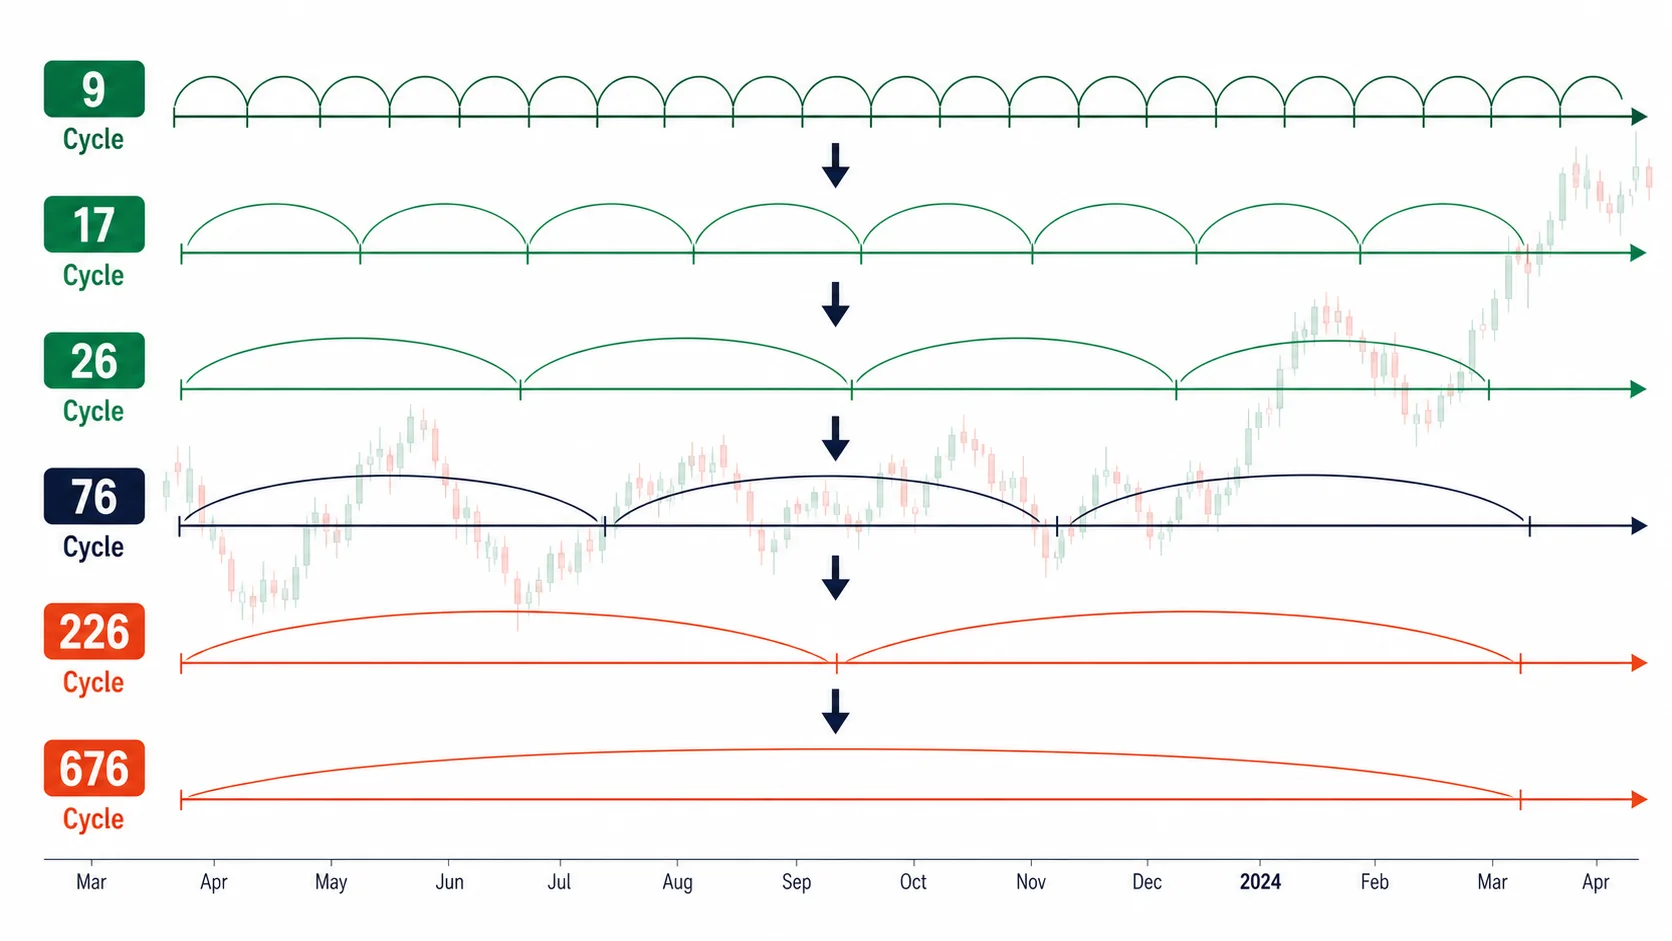
Small numbers count the knots of short moves; large numbers count the knots of long moves. On a daily chart, 9·17·26 looks at changes within a few days to a month, while 76·226·676 looks at large turns spanning several months to several years. You pick which tier to count according to the span of time you are watching.
Simple numbers and composite numbers
The numbers so far, such as 9·17·26·76, are the simple numbers. They form the basic skeleton, obtained by joining one segment repeatedly. In practice, other numbers often turn up as change days between these simple numbers: 33, 42, 51, 65, 83, 97, 101, 129, and 172. These are the composite numbers.
Composite numbers come from combining simple numbers. The 33 is the number left after joining 17 and 17 and subtracting the overlap: 17×2−1=33. The 65 is two 33s joined: 33×2−1=65. Larger composite numbers form the same way, by joining simple numbers repeatedly. So the numbers run 33·42·51·65·83·97·101·129·172, and above them comes a band that exceeds 200.
Among the composite numbers, the notation for 51 is split. By derivation, the established figure is 26 joined twice with the overlap subtracted: 26×2−1=51. Some sources write 52 in its place instead. As a time-theory composite number, it is taken as 51, following the derivation. Meanwhile, Leading Span B of the cloud (Kumo) from Part 1 is a line that looks at 52 bars. The 52 is a legitimate number for Leading Span B's span period, while the 51 is the derived value of a time-theory composite number. Even as numbers in the same low-50s range, one is a bar count for computing a line, the other a bar count for counting change days.
Adding the composite numbers makes the change-day candidates denser. As composite numbers like 33·42·51·65 fill the gaps between the simple numbers 9·17·26·76, countable candidates appear even at spots far from the origin point.
The 200–257 band seen in practice
Around the large-tier simple number 226 lies a change-day band often seen in practice, running roughly from 200 to 257. On a daily chart this band corresponds to about ten trading months and frequently appears when counting the knots of a large move spanning close to a year.
The reason this band gathers around 226 is clear. The 226 is a large simple number built by joining the 76 three times, and composite numbers line up around it, crossing past 200. With numbers like 200·226·257 gathered into one band, when counting the turn of a long trend you treat the whole band as a strip of change-day candidates rather than picking out a single number.
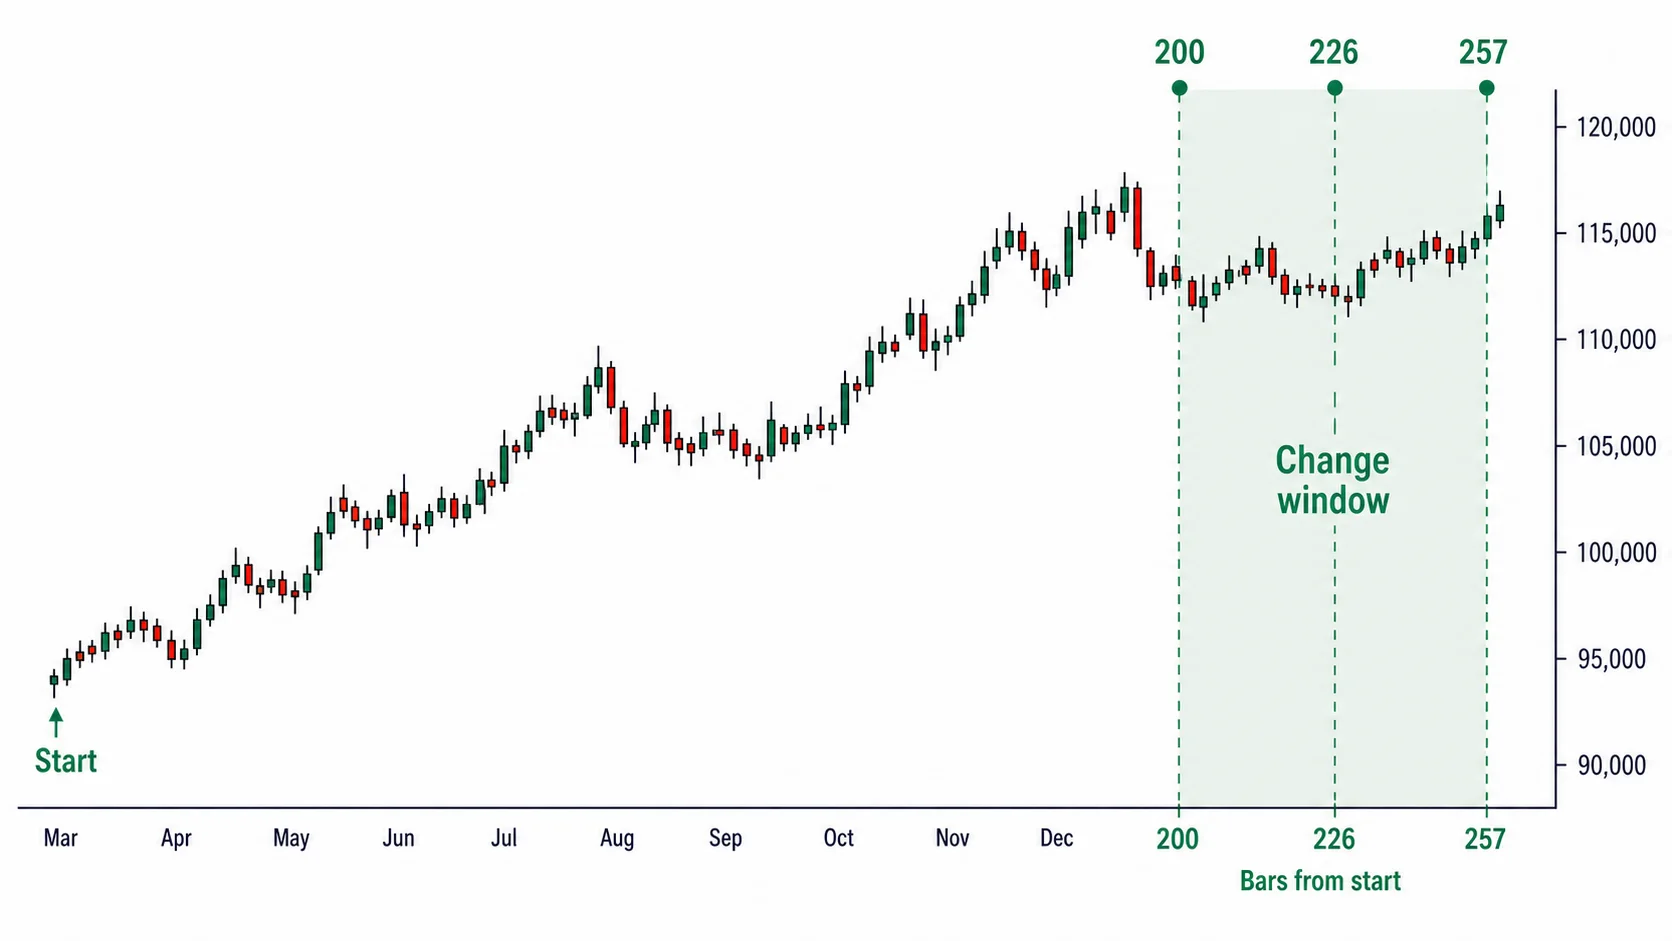
The higher the tier, the harder it is to pinpoint a single number exactly, so reading it as a band suits practice better. In short segments a single number is sharp, like 9 bars or 26 bars, but in long segments past 200, an error of a few days creeps in easily. Anyone watching the change day of a long move treats 200–257 as one strip and reads wave and price target together within it.
Both-ends counting, with the origin bar counted as 1
There is one rule for counting change days: the bar that serves as the origin point is counted as 1. This is called both-ends counting (両端計算).
To measure the distance between two bars, people usually subtract the front bar's index from the rear bar's index to get the difference. Time theory does not work that way. Because the origin bar itself counts as 1, the change day at the ninth bar from the origin is the ninth bar with the origin counted in. Counting by difference makes it the eighth bar, off by one bar. You have to add 1 to the difference of the bar indices to match both-ends counting.
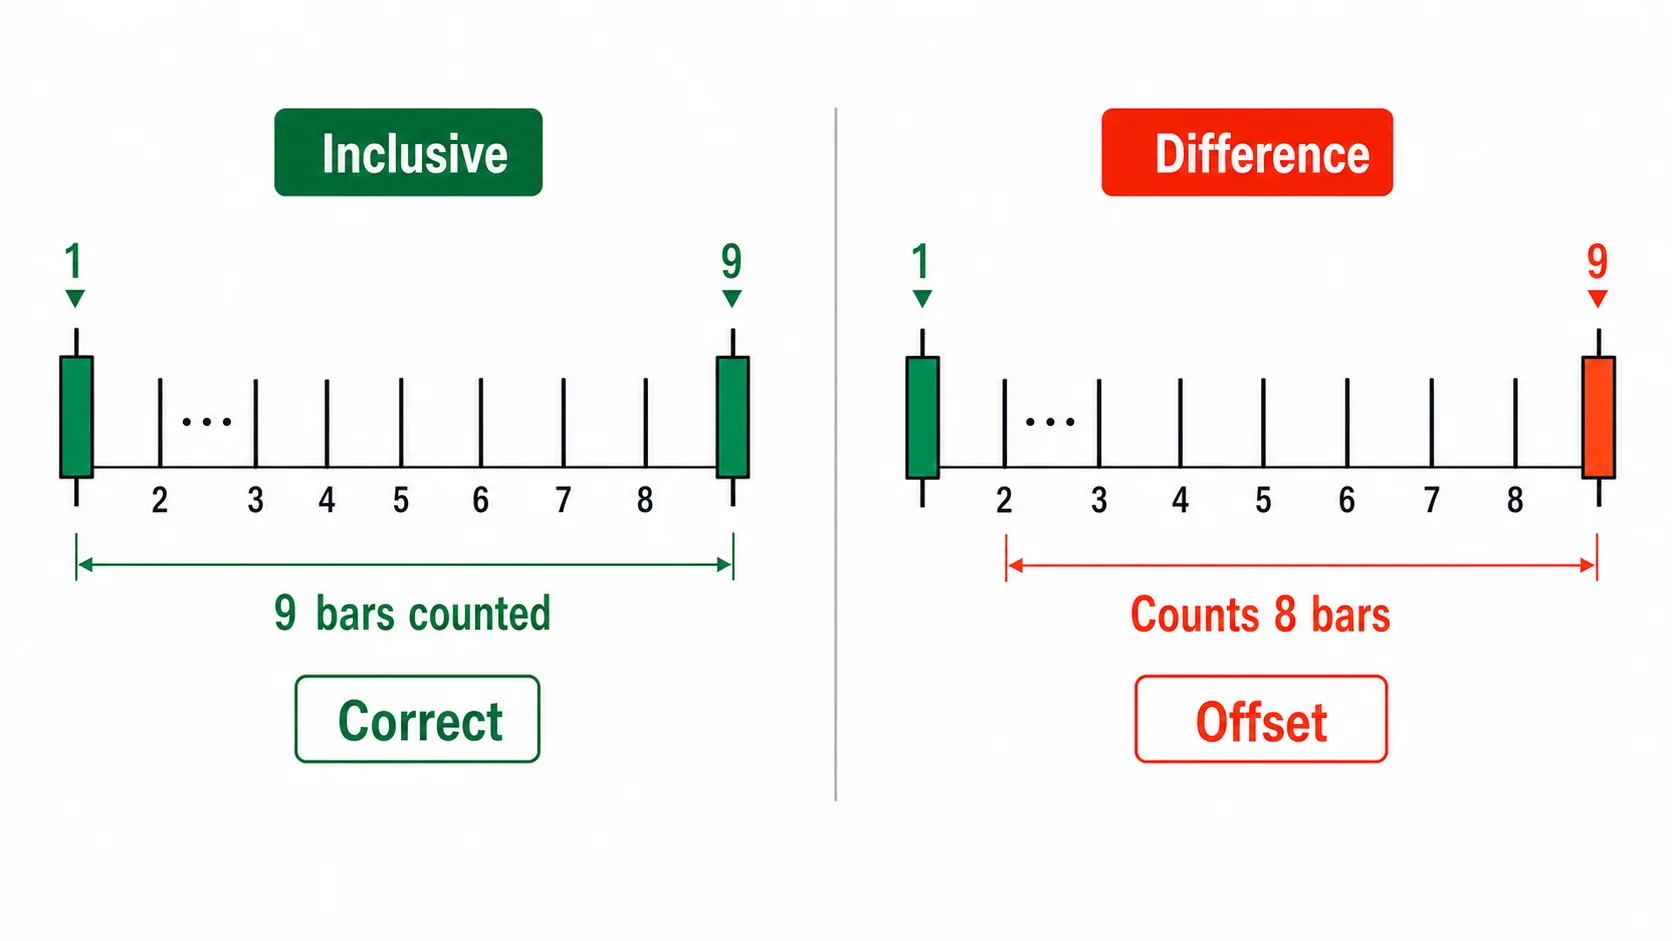
This one-bar difference is the same kind of problem as the displacement from Part 1. In Part 1 we said that shifting the Leading Span and the Lagging Span by 26 bars including the current bar makes 25 actual cells. Counting by including versus excluding shifts the result by one cell, and the one-bar difference in both-ends counting follows the same principle. What matters is counting consistently in one direction. Once you have settled on both-ends counting, which includes the origin as 1, you count every change day that way. Whether counting by hand or coding a scanner, fix the rule of adding 1 to the difference of bar indices in one place and apply it the same way to every origin point. Drop this one bar in even a single place, and every change day shifts by one bar across the board.
Change days do not know direction
Counting a change day does not tell you where price will go. A change day is merely a point in time when a change is likely; it does not tell you whether that change is an upward turn or a downward turn.
Two things can happen at a change day. One is a reversal, where the trend breaks: a rising price tops out at the change day and turns down, or a falling price bottoms out and turns up. The other is acceleration, where the move speeds up: a rising price passes through the change day and steepens its slope to climb faster. A change day is a spot where either can happen, and which one it will be cannot be known from time theory alone.
For this reason a change day is not used as a signal to enter directly. It is treated as an alert window. The change day together with the 1–2 bars before and after it are bound into one zone, and only within that zone do you accept other signals. Within the window you check whether wave theory produces the shape of a completed wave and whether price-target theory reaches an N/V/E/NT target price zone. The change day fixes the timing, and at that spot wave and price target confirm the direction.
Wave and price-target signals that appear outside a change day are graded one level lower. Because they appear where the time has not ripened, the same shape carries less reliability. Take signals inside the change-day window as your standard, and treat signals outside it as reference only.
How to read change days in a trend
The fact that a change day can be either acceleration or reversal becomes a working rule directly in a trending market. When you reach a change day, you tell the two apart by watching whether the trend continues as is or whether the immediately preceding trend structure breaks down.
If the immediately preceding high-low structure holds at the change day, treat it as acceleration. If a rising trend passes through the change day yet holds its prior low and renews its high, that is a spot where the move speeds up, so you follow along in the trend direction. If the immediately preceding trend structure breaks down at the change day, treat it as a reversal. If a rising trend fails to clear its high at the change day and breaks its prior low, that is a spot where the direction turns, so you prepare an opposite position.
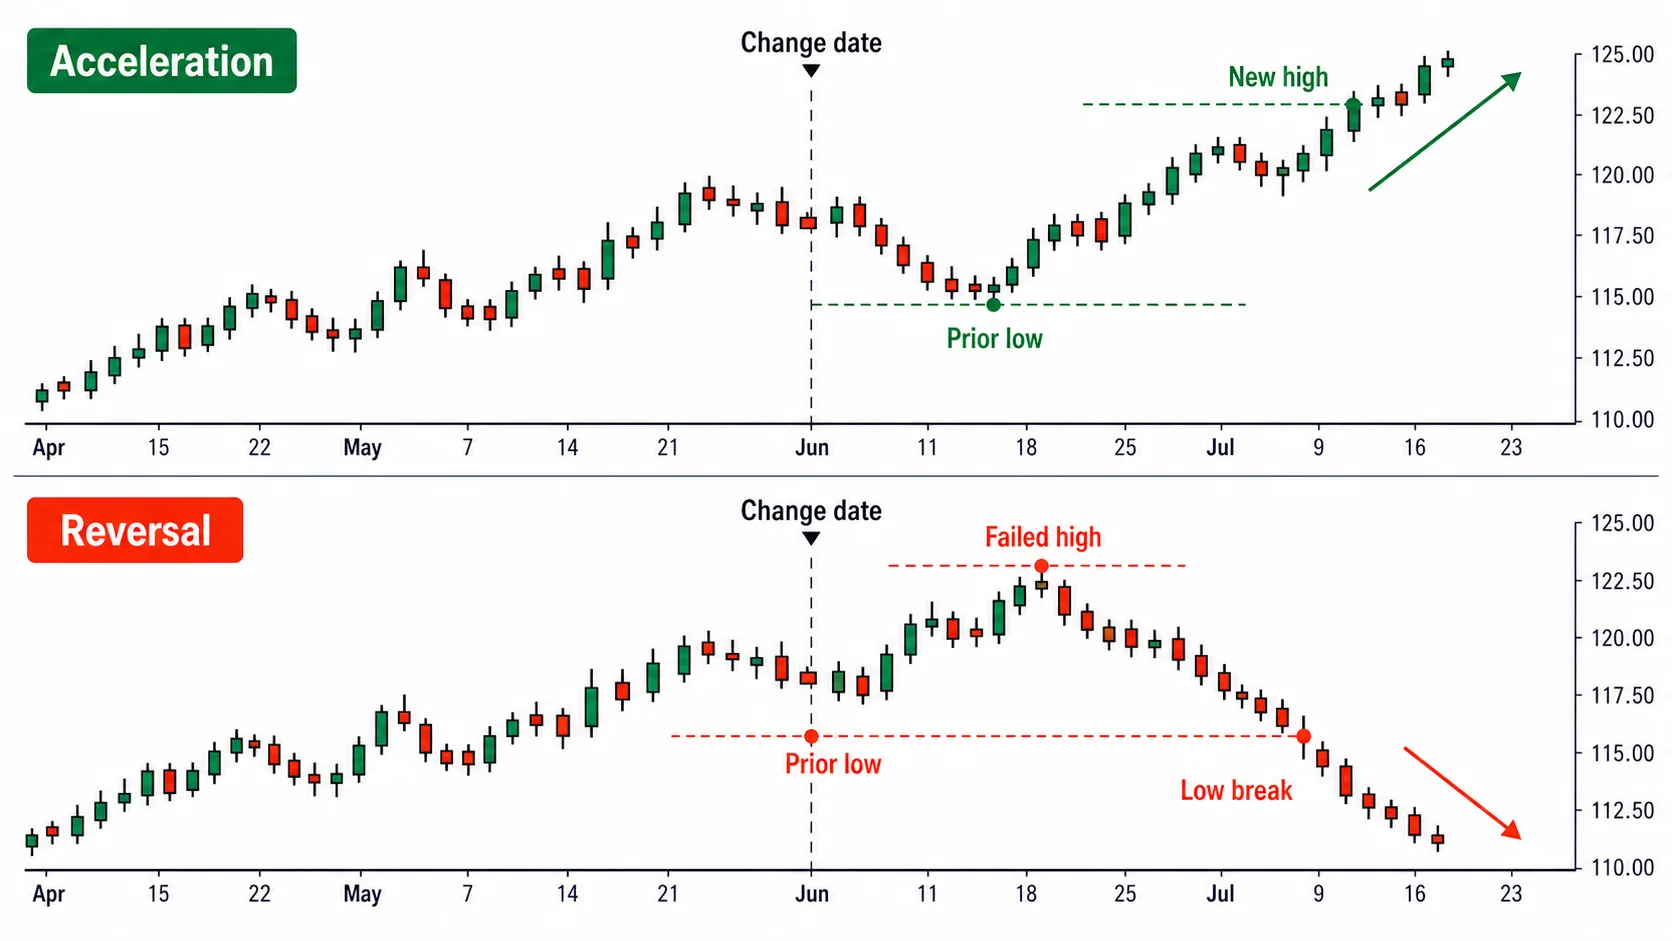
Ahead of a change day, prepare both scenarios in advance. Before reaching it, set out together the reference level for trend continuation and the reference level for trend breakdown, confirm at the change day which one holds, and then move in that direction. If you only start weighing direction once the change day is upon you, you are a step behind and cannot respond either way.
Counting bars in a 24-hour market
Time theory was built on the daily chart. One bar is one day, 9 bars are nine days, and 26 bars are about a month. The markets Hosoda dealt with had fixed opening and closing times, so one clear bar formed per day.
The cryptocurrency market never closes; it runs around the clock, twenty-four hours a day. So the count that treats one daily bar as one day still holds, but as you drop to shorter time units, the meaning of a bar changes. On the 4-hour or 1-hour chart, one bar is not a day, so you take 9·17·26 not as dates but as bar counts as they stand. On the 4-hour chart, 26 bars is a little over four days, and on the 1-hour chart, 26 bars just past one day.
The key is to count change days by bar count rather than by date. On any time unit, you set the 9th, 17th, and 26th bars from the origin point as change-day candidates and accept signals within that time unit. On a daily chart those candidates fall a few days out; on a 1-hour chart they fall a few hours out. Even when the time unit changes, the rule for counting bars is the same.
That said, the finer you split the time unit, the faster bars pile up, so change-day candidates grow denser and an overlap means less. On short bars, spots that coincide by chance increase, so apply stricter standards when picking a day where multiple origin points gather. When carrying time theory to short bars, keep the bar-count rule as is but raise the threshold for overlaps; that is the safer course.
This covers the basic numbers, which apply the same way to every chart. The equal-count numbers (Taitō Sūchi), which measure change days by the bar counts a symbol draws out on its own, and the method of picking spots where the change days of multiple origin points overlap on a single day, are covered in Part 11.