OptiNod Academy
Ichimoku — Equal Counts and Change Days
9·17·26 is active time, fixed for every chart; equal-count numbers are passive time, measured from the bar count an instrument draws itself. Days where both counts overlap are the strong candidates.
Active time is a fixed interval such as 9·17·26; passive time is the bar count the instrument itself has measured.
Time is the subject of the market
Part 10 explained why Goichi Hosoda placed time theory first among the three pillars. It is the pillar that measures, in advance, the day on which a change is due. Where Part 10 covered the basic numbers that apply identically to every chart, this part covers the equal-count numbers (Taitō Sūchi), which measure the change day from the bar count an instrument has drawn for itself.
Active time and passive time
The basic numbers 9·17·26 covered in Part 10 are fixed intervals that fit every chart in the same way. Whatever the instrument and whatever the timeframe, you count the 9th, 17th, and 26th bars from a starting point. Hosoda called intervals fixed in advance like this active time, because they are drawn first regardless of how the market moves.
Passive time is the opposite of active time. It is the time you obtain by measuring the bar count an instrument actually produces as it moves. Some instruments run from high to high in around 30 bars, while others stretch the same move past 40 bars. Because the market shows the bar count first and you then measure along with it, this is passive time. If active time gives you the basic numbers, then the value you obtain by measuring passive time is the equal-count numbers that are the subject of this part.
The basic numbers are a ruler applied in common to every chart, while the equal-count numbers are a ruler fitted to that one instrument alone. You measure the same change day from both sides with the two methods. A change day measured from only one side is less solid than one that both methods point to on the same day.
Equal-count numbers transpose a recurring bar count
An equal-count number (対等数値) is the value you obtain by measuring the bar count an instrument took from a previous high to a high, or from low to low, and transposing the same length forward. If the previous up-wave took 31 bars, you treat the present wave as a place where a change is likely at a similar bar count. It transposes onto the time axis the tendency for the same wave shape to recur at a similar bar count.
The measurement is simple. You take the bar on which the previous high sits as 1 and count to the bar on which the next high sits using both-ends counting. As shown in Part 10, you must include the starting bar as 1 in the count, which makes the value the bar-index difference plus 1. Transposing that bar count forward again from the present high or low produces the next change-day candidate. When counting bars with a signal scanner, it is easy to drop this +1 of both-ends counting, so fix the offset of adding 1 to the index difference in the code.
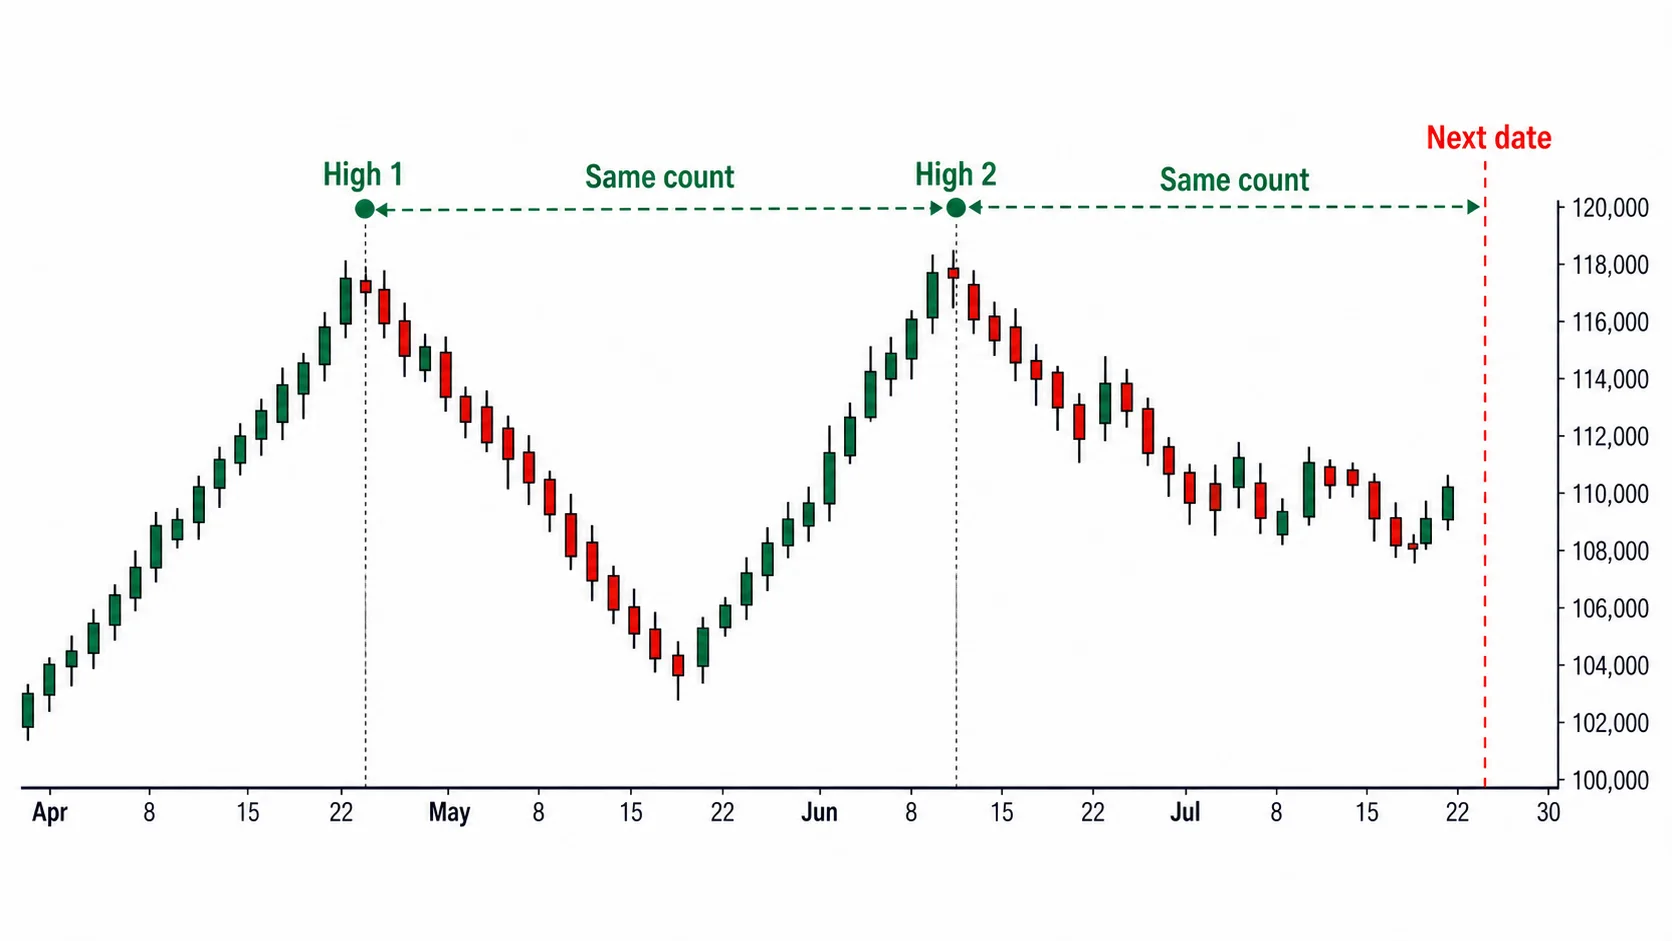
In addition to high-to-high, you measure low-to-low as well. In the verified Ajinomoto case, high to high ran 31 bars then 30 bars, nearly the same, while low to low ran 33 bars then 34 bars, again nearly the same. Even though it does not line up to the exact bar, it shows that the instrument repeatedly recurs at a similar bar count.
A flat claim such as "the same wave shape repeats exactly every 101 bars" cannot be confirmed against primary sources. What the equal-count numbers describe is the tendency for a similar bar count to recur. You do not assert that 31 bars recur as exactly 31 bars; you treat the area around 31 bars as the change-day candidate window.
A day where both methods overlap is a strong candidate
The basic numbers and the equal-count numbers carry more weight when they point to the same day than when each is drawn separately. If the 26th bar counted from one starting point happens to fall on the same day as an equal-count number transposed from another starting point, that day is a place both methods have marked together. Hosoda raised days where change days overlap to higher-priority reversal candidates.
Overlap also arises within one type of count. If you count basic numbers from several starting points, the 17th bar from one starting point may land on the same day as the 26th bar from another. The equal-count numbers, too, can have the day transposed from high-to-high overlap with the day transposed from low-to-low. The more counts that gather on one day, the higher that day's priority rises.
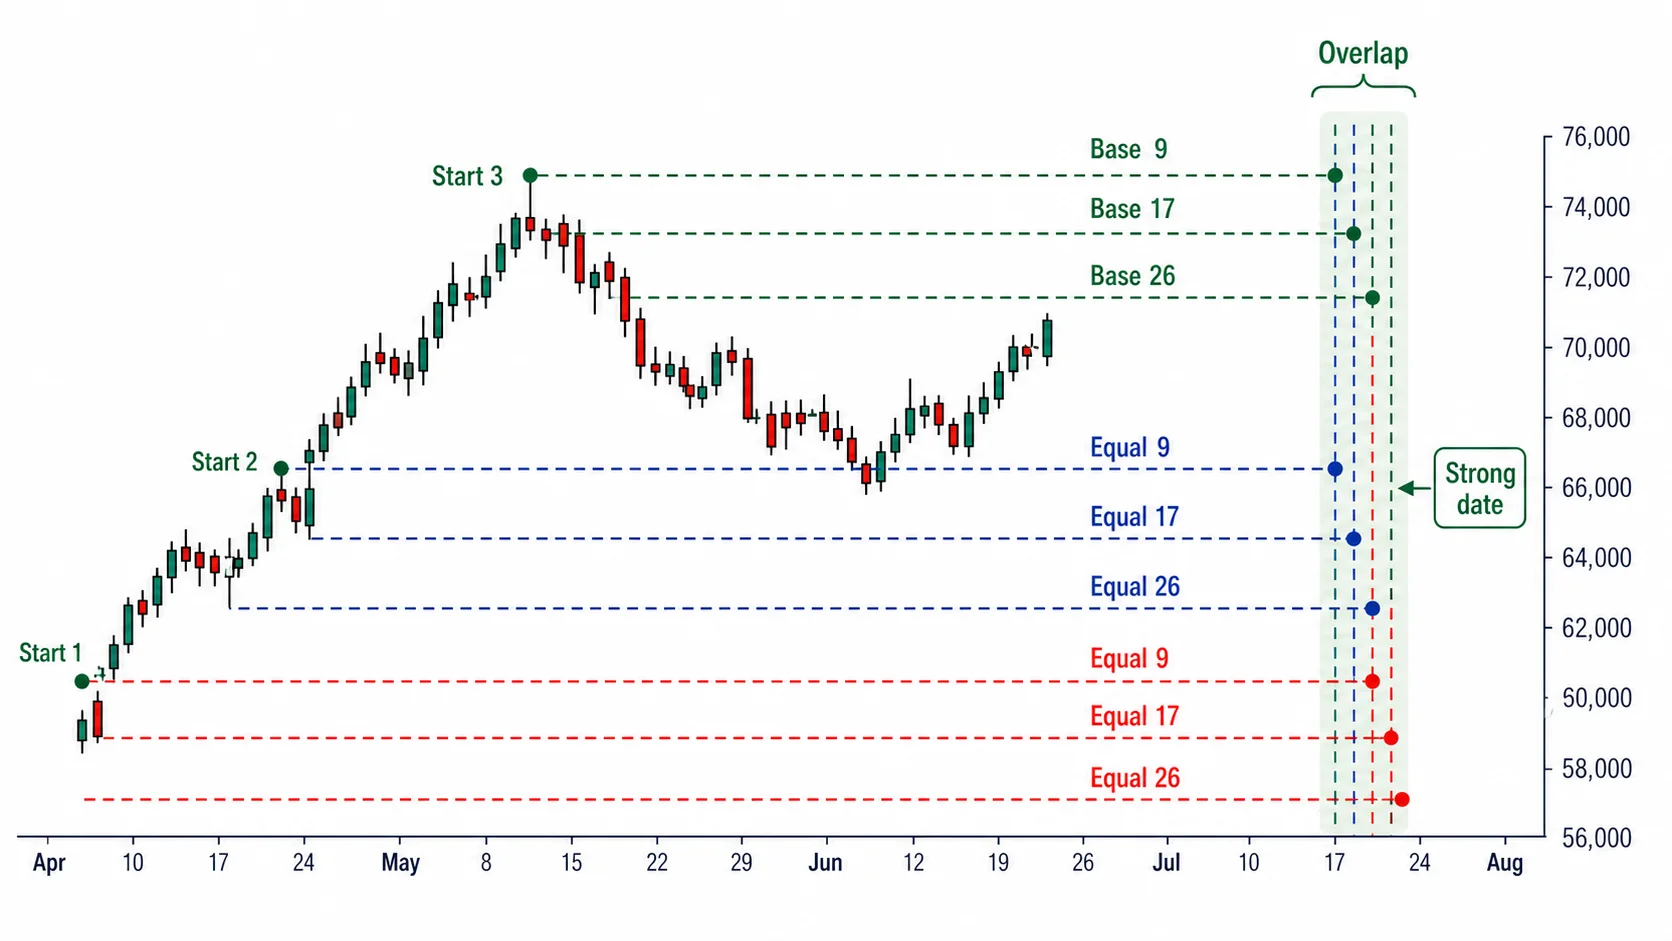
Once you have picked out these overlapping days, a few change-day candidates are marked in advance on the chart. Among them, you look first at the days where several counts gather. You hold the days marked by only one count lightly and treat the days where several counts gather as strong candidates.
26 is an integer, and adjusted values weigh both sides
There is a line of argument around basic number 26 that, because crypto trades 24 hours, 26 must be changed to a different value such as 22. The 26 is an integer fixed within the derivation system of time theory. The core of time theory lies in counting the number of traded bars. As long as you keep the principle of counting traded bars, you keep counting 26 even when the timeframe changes.
That said, several crypto adjustment values have been proposed. Among them are 10-30-60, the 20-60-120 with a displacement of 30, and 7-22-44. They are proposals to adjust the line periods in light of the bar density of a 24-hour market. On the other hand, there is also a counterargument that changing the defaults misaligns the 26-bar displacement with the time axis of time theory. You judge an adjusted value with both the rationale of matching bar density and the counterargument that it misaligns the time axis in view.
Keep the limits of verification honest
The equal-count numbers have a weakness that must be pointed out honestly. Depending on where you take the starting point, and on whether you look at high-to-high or low-to-low, several candidate dates emerge. When there are many candidates, one of them tends to line up with an actual reversal, and people remember only the ones that hit and forget the ones that missed. When this hindsight bias creeps in, time theory looks as if it fits better than it really does.
Because the structure layers multiple comparisons and after-the-fact selection, it is very hard to disprove time theory quantitatively. If you draw a great many change-day candidates and then count only the lines that hit after the fact, the hit rate comes out high, but that figure is hard to regard as verification. Unless you acknowledge this weakness, time theory drifts into curve-fitting.
For that reason, change days are not used on their own. A change day itself knows no direction and is hard to disprove quantitatively, so you refer to it only when a price signal from wave theory or price-target theory (Nehaba Kansoku) arrives at that place at the same time. If an N-wave breaks the previous extreme and completes in the change-day window, or price reaches a price-target-theory target, then time and price have pointed to the same place, and you confirm an entry or exit. A trade entered on a single change day with no price signal is not treated as a setup.
Short is measured with the same ruler
The counts so far have nothing to do with up or down direction. Because the equal-count numbers measure high-to-high and low-to-low together, you use them as is in a downtrend as well. Measuring the bar count taken from the previous low to a low and transposing it forward produces the change-day candidate of a downtrend.
In a short, too, a change day knows no direction. If the downtrend holds on that day, you read it as downside acceleration and follow the move; if the trend breaks on a closing basis, you read it as a reversal off the bottom. If price breaks the previous low and completes an N-wave downward in the change-day window, or reaches a price-target-theory downside target, then you confirm a short entry or exit. Here, too, you do not take a short on a single change day alone.