OptiNod Academy
Ichimoku — Not Just a Cloud Indicator
What Hosoda placed first was time theory, and the cloud is only one secondary piece — the core is the three pillars: time, wave, and price-target theory.
When you pull up Ichimoku Kinko Hyo on a chart, the first thing that catches your eye is the cloud. So many people treat "long above the cloud, short below it" as the heart of Ichimoku. But what Goichi Hosoda placed first was time theory, and the cloud is only one secondary piece.
What the Name Means: Balance at a Glance
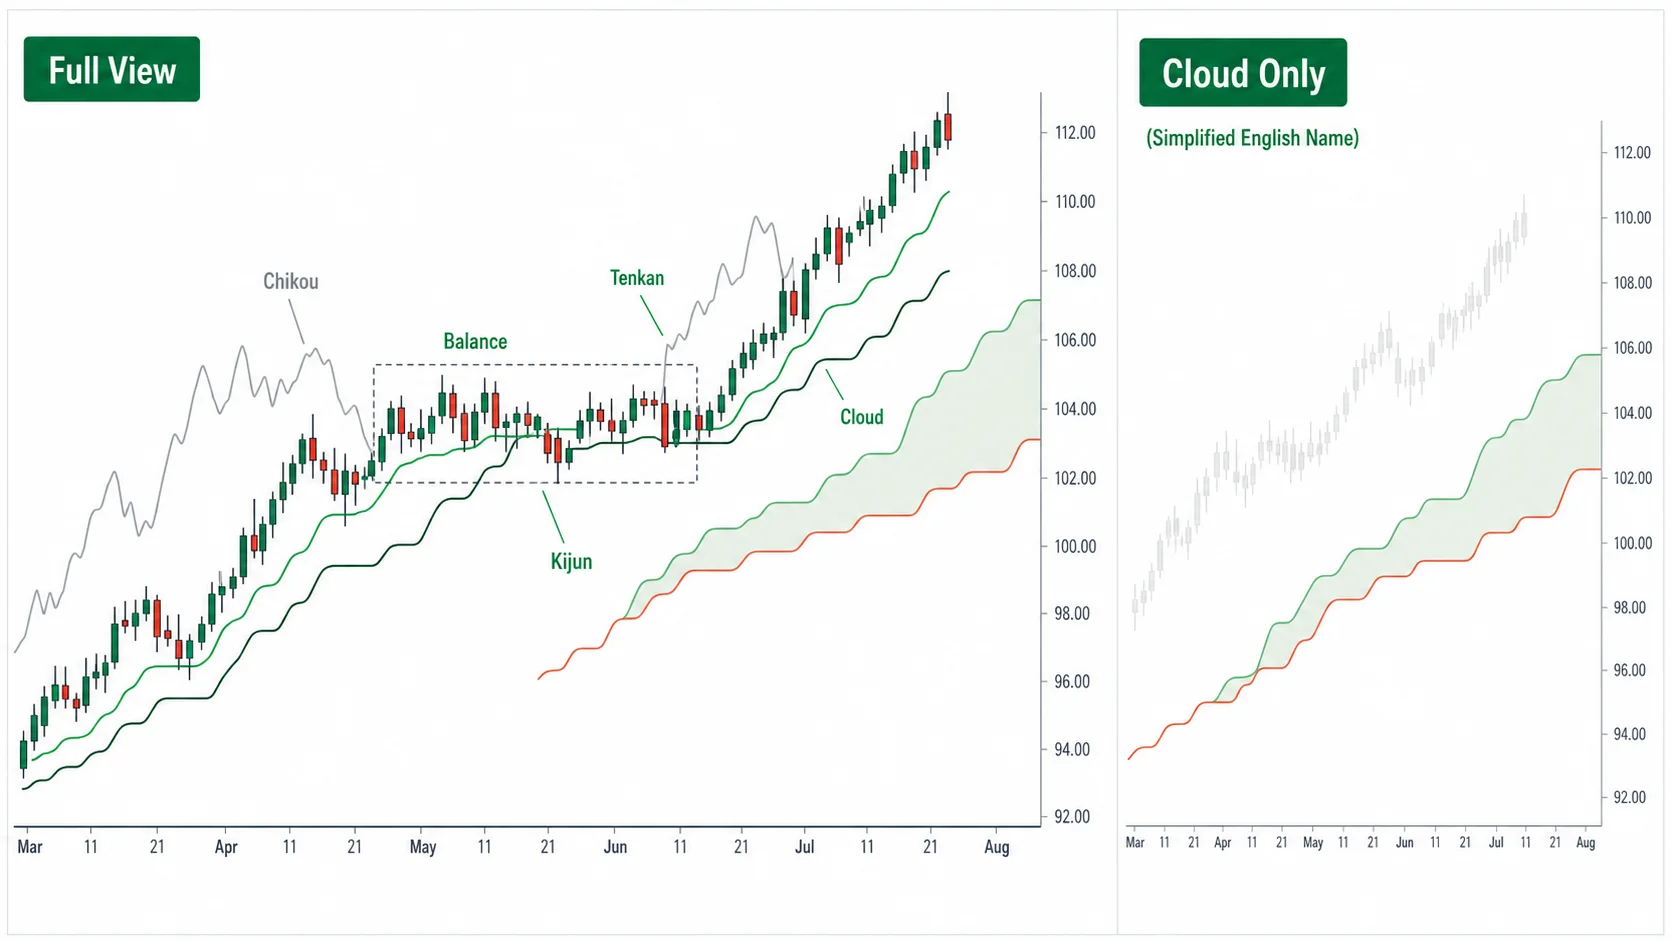
The name Ichimoku Kinko Hyo (一目均衡表) has three parts. 一目 means "at a glance," 均衡 means "balance," and 表 means "chart." Together they mean a chart that shows the balance of the market at a glance. Nowhere in the name is there any word for "cloud."
In the English-speaking world this indicator is usually called the "Ichimoku Cloud." Because the first thing your eye lands on when you load the chart is the cloud filling the space between two lines, that part gave the indicator its name. Balance, the core of the name Hosoda gave it, dropped out of that label.
What 均衡 points to is the balance between buying pressure and selling pressure. When the force of the buyers and the force of the sellers run into each other and reach a standstill, that is balance, and the market view built into the name holds that the moment that balance breaks to one side, the market moves hard in that direction. Ichimoku Kinko Hyo is a tool for seeing, at a glance, the point where this balance breaks. Asking whether the balance has broken is the original way to use this chart.
均衡 Is Not an Average Line
Some people read 均衡 as the average or the midline of price. The misunderstanding comes from the fact that the Conversion Line (Tenkan-sen) and the Base Line (Kijun-sen) are computed as (high + low) ÷ 2 over a window — that is, the midpoint. But 均衡 does not refer to the arithmetic average of price. It refers to the balance that forms when two forces, buying pressure and selling pressure, run into each other.
The two concepts sit at different levels. The midpoint line is the sum of the high and the low over a fixed window divided by two, and as Part 1 covered, it freezes flat whenever there is no new high or low. It does not glide along smoothly bar by bar the way a moving average does; its value changes only when a new high or a new low prints. This line is the yardstick for measuring balance, and you read which way the two forces are leaning from how the lines sit relative to each other.
Hosoda had two reasons for adopting the midpoint. The deeper one was the idea of capturing in a single number the balance value that forms when buying pressure and selling pressure run into each other over a fixed window; on top of that came the practical convenience of being able to derive it directly from the high and the low alone. The idea of a balance value comes first, and the calculational convenience is the secondary reason.
Why Only the Cloud Was Passed Down
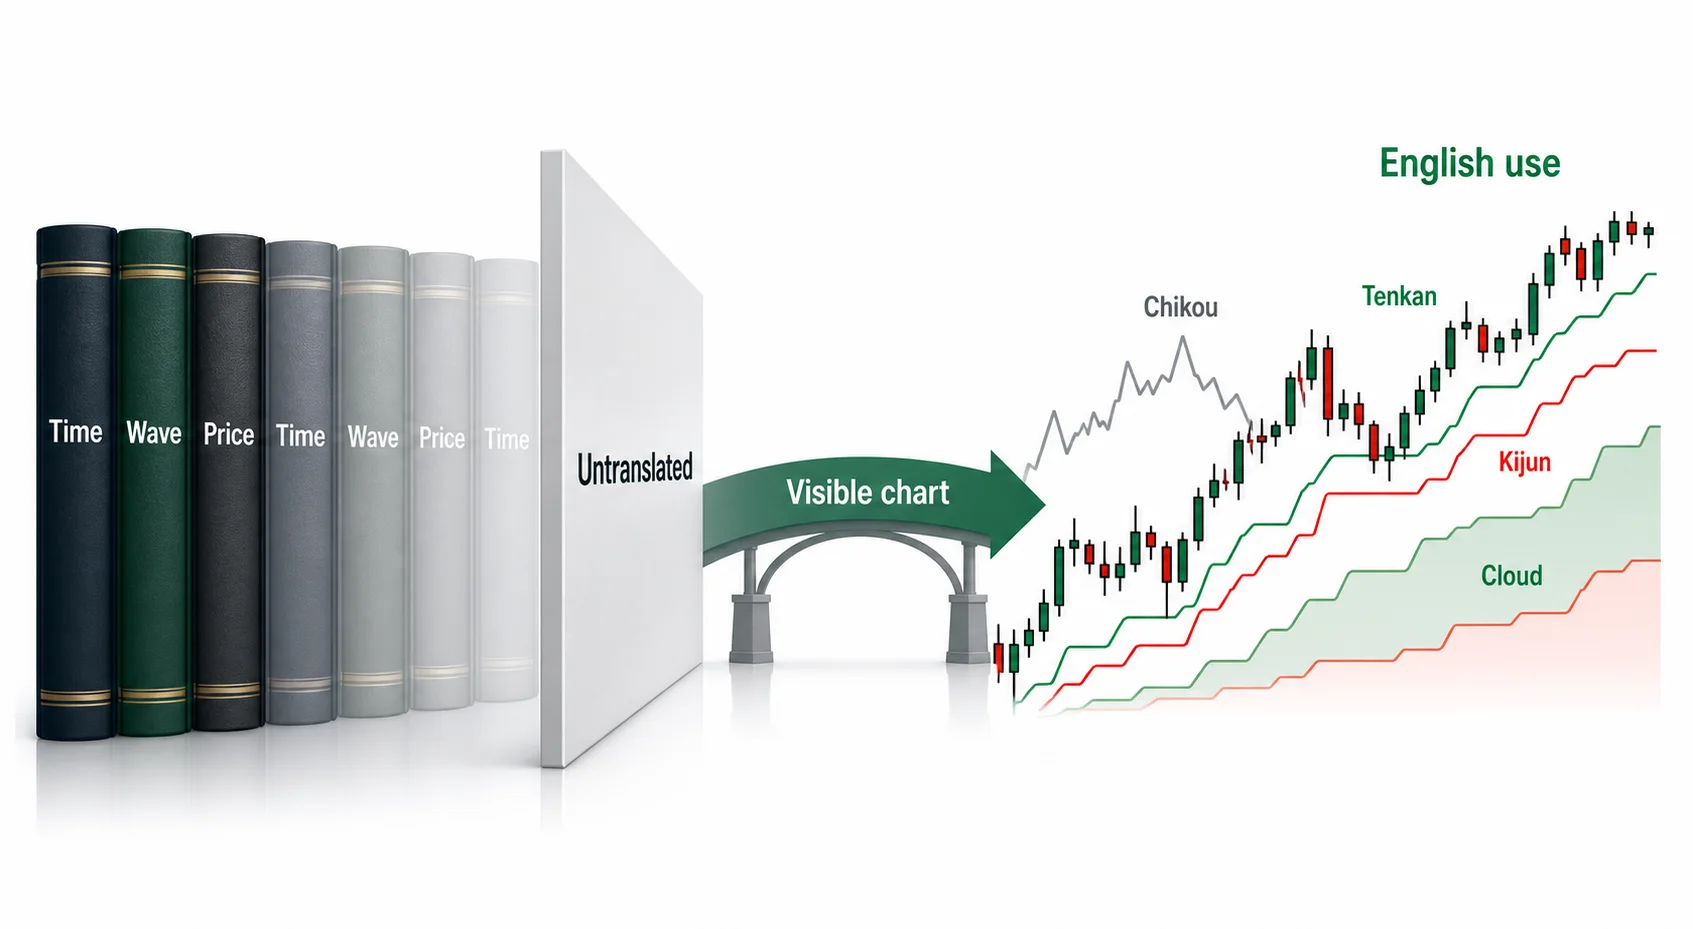
Goichi Hosoda was a former markets reporter at a newspaper's market desk. In 1935 he first published his analytical method under the name Shinto Tenkan Line (新東転換線), and he put a large staff to work counting past markets by hand and refining the numerical relationships. He laid out the result in seven original volumes, which began appearing in 1969 and were completed in 1981. The five lines and the cloud are one part of that vast body of work; the core is the three theories — time theory, wave theory, and price-target theory (Nehaba Kansoku).
These three theories have to be laid out at length in prose, so chart pictures alone cannot convey them. When Ichimoku became known in the English-speaking world, these seven volumes were never translated; the prose did not carry over, and only the chart pictures crossed the language barrier. What is visible at a glance on a chart is just the five lines and the cloud between them, so time theory, wave theory, and price-target theory could not follow on pictures alone.
As a result, a simple usage centered on the cloud took hold in the English-speaking world. "Long when price is above the cloud, short when below" came straight out of this gap. It looks only at whether price is above or below the cloud — read straight off the chart — and drops the time theory Hosoda placed first entirely.
The Core Is the Three Pillars
As Part 6 covered, the core of Ichimoku is the three pillars — time theory, wave theory, and price-target theory. Time theory counts in bars when the market turns, wave theory looks at the shape in which the market moves, and price-target theory measures how far the market will go. They are three axes that each handle when, how, and how far.
The five lines and the cloud are devices that support these three theories on the chart. Hosoda himself put the three pillars at the core and placed the five lines beneath them. Looking only at the five lines and dropping the three pillars leaves the core of Ichimoku entirely empty and uses only the support devices.
Of the three pillars, Hosoda regarded time theory as first. He asked first when the market turns, and only then measured how far it goes. As Part 10 covered, time theory uses bar counts like 9·17·26 and change days to work out in advance where the market will turn. These numbers — 9·17·26 — are linked by a derivation relationship. 17 is 9×2−1, and 26 is 9×3−1. They partly overlap with the line periods 9·26·52, but the two are different systems. 9·17·26 are the basic numbers of time theory, and 9·26·52 are the line periods used to compute the five lines.
Separating Assumption from Prediction
Hosoda's analytical philosophy rests on separating assumption (予想, yosō) from prediction (予測, yosoku). An assumption is a vague belief that the market looks like it will rise — that is, 思い込み, a fixed notion. A prediction measures in advance, as a number, where the market will turn, and then revises your own logic if the market diverges at that point. Ichimoku is a tool for discarding assumption and making prediction.
The discipline of placing time theory first comes from here. If you work out the change day in bars in advance, you can check your own judgment against whether the market turns there. If the market turns on the change day, the measurement was right; if it does not turn, you fix the logic. Without a point measured in advance, you cannot escape assumption — shifting your beliefs from moment to moment as you watch the market. This discipline of asking when first comes out of the philosophy of prediction.
Reading by Whether the Balance Has Broken
Once you drop the habit of reading the chart as above or below the cloud, the question that takes its place is whether the balance has broken. As Part 1 covered, the Conversion Line is the center of the short-term trend, and the Base Line is the center of the medium-term trend. When the two lines sit close together, the short-term and medium-term centers are in the same place — a state of balance — and the moment the gap between the two lines widens is where that balance breaks to one side.
When the Conversion Line widens above the Base Line, the short-term center has risen faster than the medium-term center, so the balance has leaned to the buying side. When the Conversion Line widens below the Base Line, it has leaned to the selling side. More than where price sits relative to the cloud, you look first at where the gap between these two lines begins to widen.
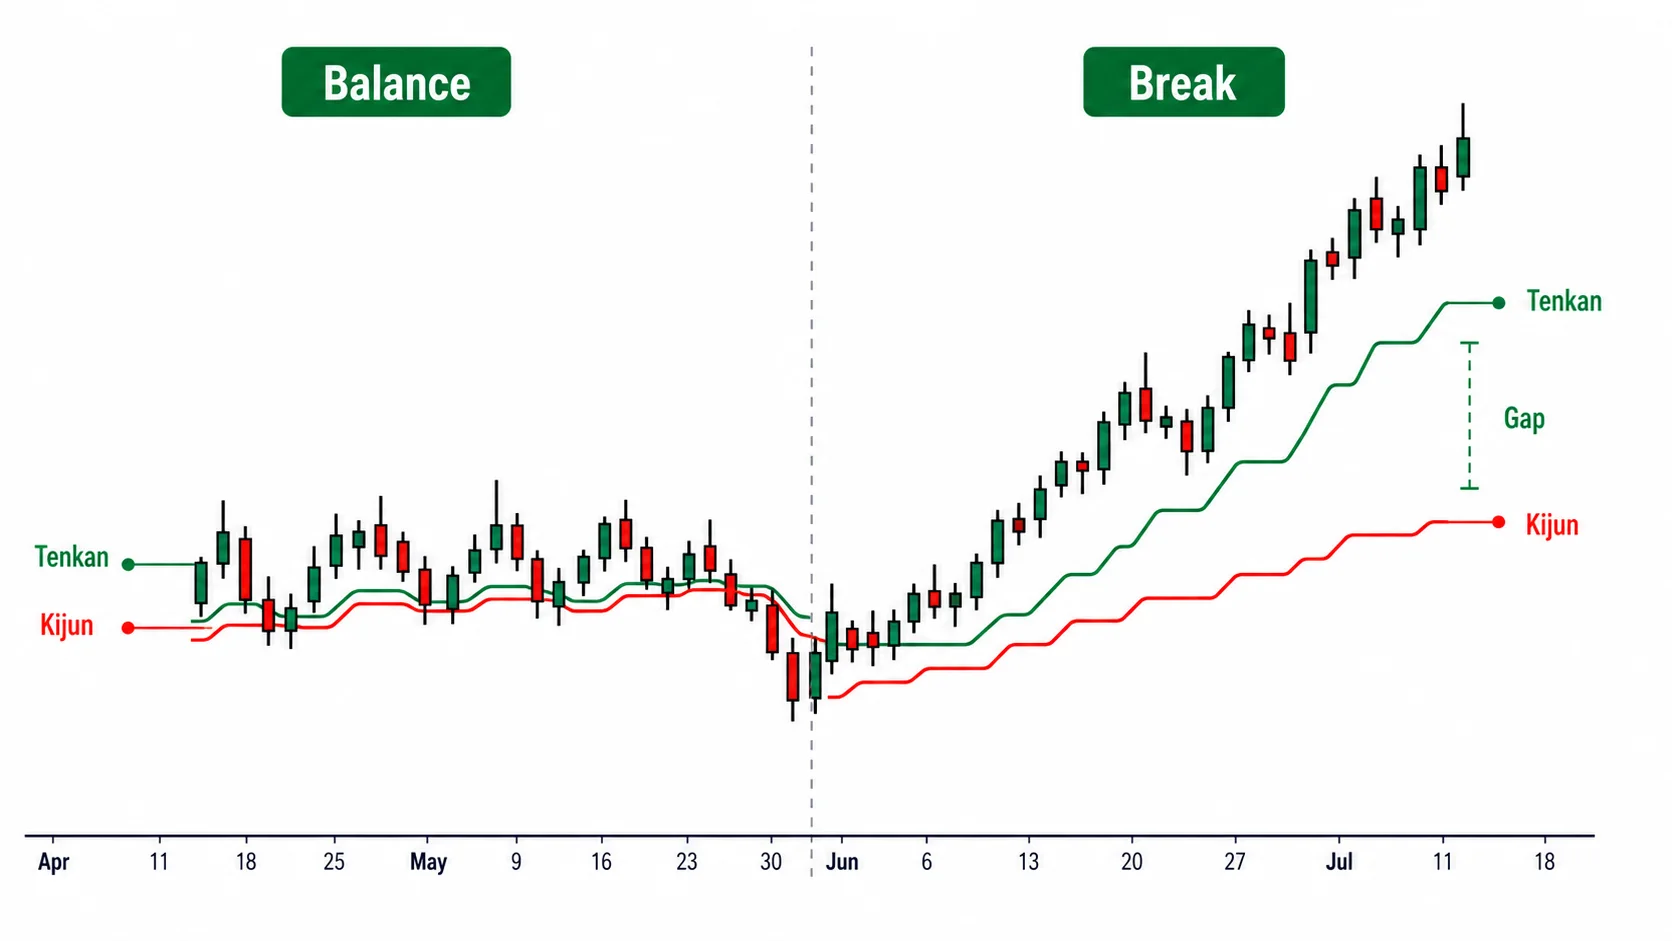
Where price sits relative to the cloud is the result of a balance that has already broken, while the widening gap between the two lines is the process of the balance breaking. Watch the process first and you catch where the balance leans without waiting for the result.
Three-Role Bullish Reversal Confirms, the Lagging Span Is the First-Tier Filter
The three-role bullish reversal (Sanyaku) covered in Part 5 is a state in which all three conditions hold. First, the Conversion Line is above the Base Line and the Base Line is rising or flat; second, the Lagging Span (Chikou) is above the price 26 bars ago; third, price is above the cloud. Price breaking above the cloud alone is not a three-role bullish reversal; all three levels must align as a bullish turn. These three conditions are not a trigger that starts an entry. They are a checklist that confirms, after the fact, that the balance has broken to one side. By the time all three conditions align, the market has already moved a good way, so using the three-role bullish reversal as an entry signal is always late.
Once you demote the three-role bullish reversal to a confirmation checklist, the point where you decide the entry comes earlier than that. You catch the balance breaking first, where the gap between the Conversion Line and the Base Line begins to widen, and then check after the fact, with the three conditions of the three-role bullish reversal, whether that judgment was right. The typical pattern is for the three conditions to align in order — from the balance-chart bullish turn, through the lagging bullish turn, to the cloud bullish turn — though there are exceptions where the order is out of sequence depending on the asset or the stretch.
Of the three conditions, the one the English-speaking world has treated most lightly is the Lagging Span. As Part 3 covered, the Lagging Span puts current price directly up against the price level 26 bars ago, so it most reliably confirms whether the current trend has actually left the price level of a month ago behind. Hosoda said directly of the Lagging Span, 一期の遅行スパン、これが最も大事 — the lagging span of one period is the most important. In other words, if you rank the five lines by priority, the Lagging Span comes first. Use this line — the one Western-style usage leaves out — as the first-tier filter, and it strains out false breakouts. If the Lagging Span cannot clear the price level 26 bars ago to the upside, you do not treat it as a setup even when price is above the cloud.
Reading Shorts with the Same Structure
The selling side reads symmetrically. When the Conversion Line widens below the Base Line, the balance has leaned to the selling side. The three-role bearish reversal is the three conditions of the three-role bullish reversal inverted: the Conversion Line is below the Base Line and the Base Line is falling or flat, the Lagging Span is below the price 26 bars ago, and price is below the cloud. On the selling side too, whether the Lagging Span has cleared the price level 26 bars ago to the downside is the first-tier filter.
Price-target theory applies symmetrically as well. The N/V/E/NT targets covered in Part 9 measure the downside target the same way they measure the upside target, inverting from the high as the starting point. If the Lagging Span cannot clear the price level 26 bars ago to the downside, you do not treat it as a short setup even when price is below the cloud.
What to Look at First and What to Defer
The redesign that runs through this series is changing the order in which you look. First you ask, with time theory, when the change day comes, and you accept signals only near that change day. The next thing you look at on the chart is the gap between the Conversion Line and the Base Line — that is, where the balance breaks. Then you confirm whether the move is genuine by checking whether the Lagging Span has cleanly cleared the price level 26 bars ago.
The cloud comes last. As Part 4 covered, the cloud is not a buy signal. The cloud is the thickness of the support/resistance band that price will meet ahead and the future terrain, so it is not where you decide the entry; it is where you gauge how thick the resistance band above price is. How far price will go is measured after that, with the N/V/E/NT targets. Put when at the very front and how far at the very back.
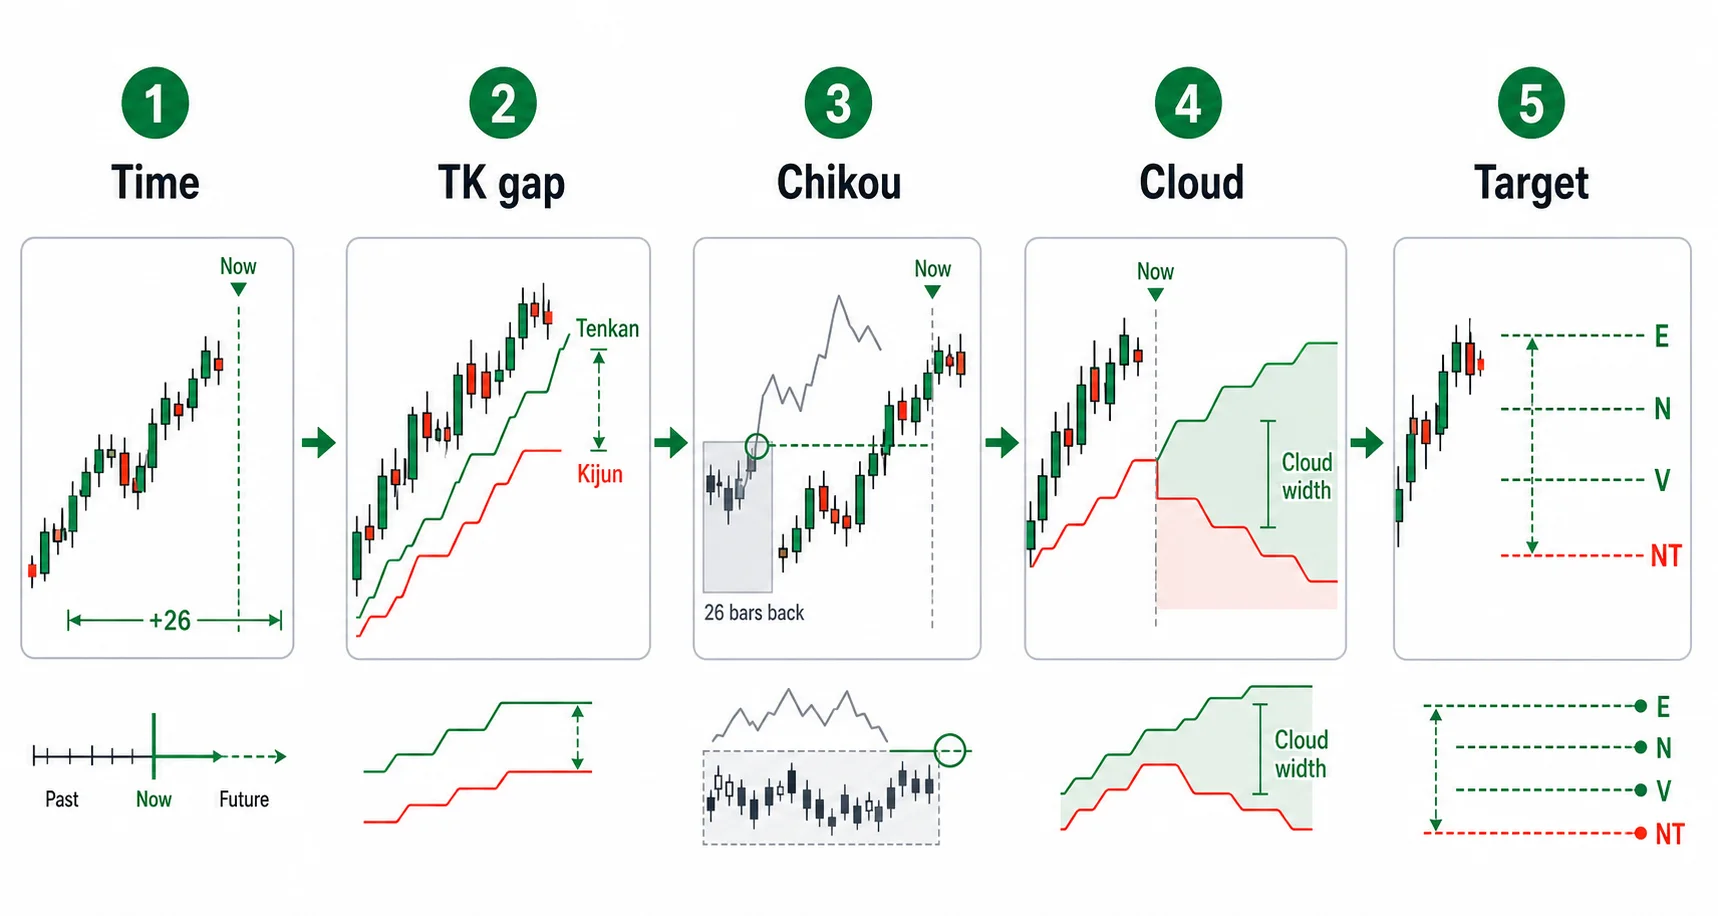
Anyone who started with the one line "long above the cloud" has this order backwards. They put the cloud at the very front and looked only at it. To use Ichimoku the way Hosoda set it up, put time theory at the very front, look first at where the balance breaks, and defer the cloud to the last position of confirmation.