OptiNod Academy
Ichimoku — Three-Pillar Confluence
Confirm an entry only where the price target, time change day, and N-wave completion overlap at one spot; when only two line up, stand aside or cut your size.
Confirm an entry or exit only when a price-target zone and a time change day meet at the same level and moment, and an N-wave completes there. When only two of the three line up, stand aside or cut your size.
The crowd reads cloud crosses; the heart of the analysis is the confluence of three pillars
When you first meet Ichimoku Kinko Hyo, you learn to treat the spot where price breaks through the cloud (Kumo), or where the Conversion Line (Tenkan-sen) crosses the Base Line (Kijun-sen), as a trading signal. The moment one line crosses another becomes the entry point. But these signals are only the surface result.
The roots of the analysis Goichi Hosoda placed behind the five lines are wave theory, price-target theory (Nehaba Kansoku), and time theory. Wave theory asks about form, price-target theory asks about the target price, and time theory asks about the moment. Cloud and line crosses are merely a display that projects onto the screen a judgment these three pillars have already made; they are not a basis for a trade in themselves. Someone who uses Ichimoku properly does not read line crosses as signals. They watch for the confluence where the three pillars meet at a single spot.
The three pillars answer different questions
Wave theory looks at form. It uses the three waves I, V, and N to pinpoint whether price is inside a single upward move, inside a pullback, or at the spot where one whole move has ended. As covered in Part 6, the N-wave is the basic form in which three moves combine into one unit of trend, and it completes only when the last move breaks the prior extreme on a closing basis.
Price-target theory looks at how far price goes. As covered in Part 9, you mark the trend-start low A, the first high B, and the pullback low C on the chart and draw the four targets. N=C+(B−A), V=B+(B−C), E=B+(B−A), NT=C+(C−A) become the target-price candidates. None of them is guaranteed to be the level that holds; you simply draw, in advance, the levels price is likely to reach.
Time theory looks at when. As covered in Parts 10 and 11, you count the origin bar as 1 and mark change-day candidates at the 9th, 17th, and 26th bars, and beyond that at the 33rd, 42nd, 51st, and 76th bars. A change day does not tell you direction. It only points to a moment when the trend may reverse, or may instead speed up.
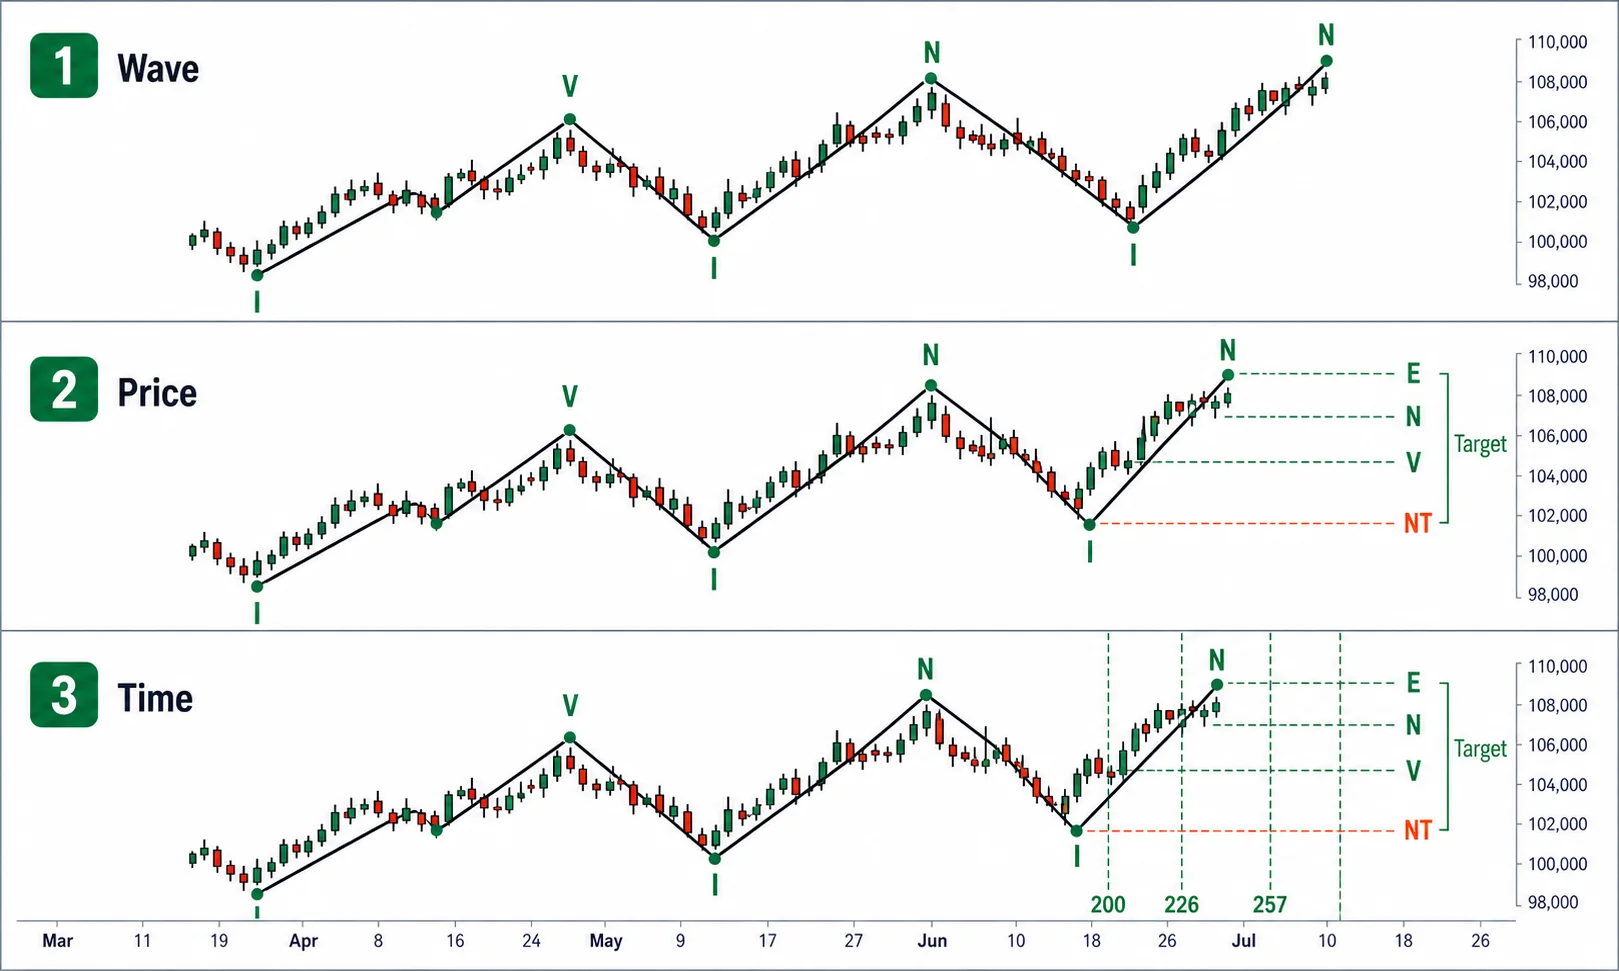
Used on their own, each of the three pillars has a gap. Look only at price targets and you know the price but not when it will be reached. Look only at change days and you know the moment but not at what price something will happen, or what that something is. Look only at waves and you know the form but lack the target and the moment. Only when you overlay all three on one chart do the gaps fill each other in.
The order in which you overlay them on one chart
Spread all three pillars out at once and the screen turns into a mess. You have to set an order and add one layer at a time for it to stay readable.
First, fix your current position with the waves. Count the prior move as I, V, and N to identify which leg of the N price is in. Following the counting routine from Part 6, the first advance is I, the move through the pullback is V, and if the next advance is in progress it is the third leg of the N. At this stage you decide the big question of whether to enter or to exit.
Next, draw the four targets at the level where the N would complete. Once you have marked A, B, and C, N/V/E/NT come out immediately. Draw all four as horizontal lines and mark the price zone where several of them cluster together as the primary target. The price-target agreement covered in Part 9 is this spot. NT is the lowest of the four values and is rarely reached, so keep it lower in priority. When picking a confluence target, look first at the zone where N/V/E cluster and use NT only as a supporting reference.
There is a reason a spot where several values cluster at the same price is stronger than a single value. The four formulas drawn from the same A, B, and C are different calculations, and when those different calculations point to the same price, several grounds are singling out one price at once. When targets drawn from different swings overlap at the same spot as well, the grounds add up further. A value that several formulas point to together carries more confidence than one that only a single formula points to.
Last, check whether that price zone overlaps in time with a time-theory change day. Take the major highs, lows, and turning points as origins, draw vertical lines at the 9th, 17th, 26th, 33rd, 42nd, 51st, and 76th bars, and confirm whether the moment price reaches the target zone falls near a change day.
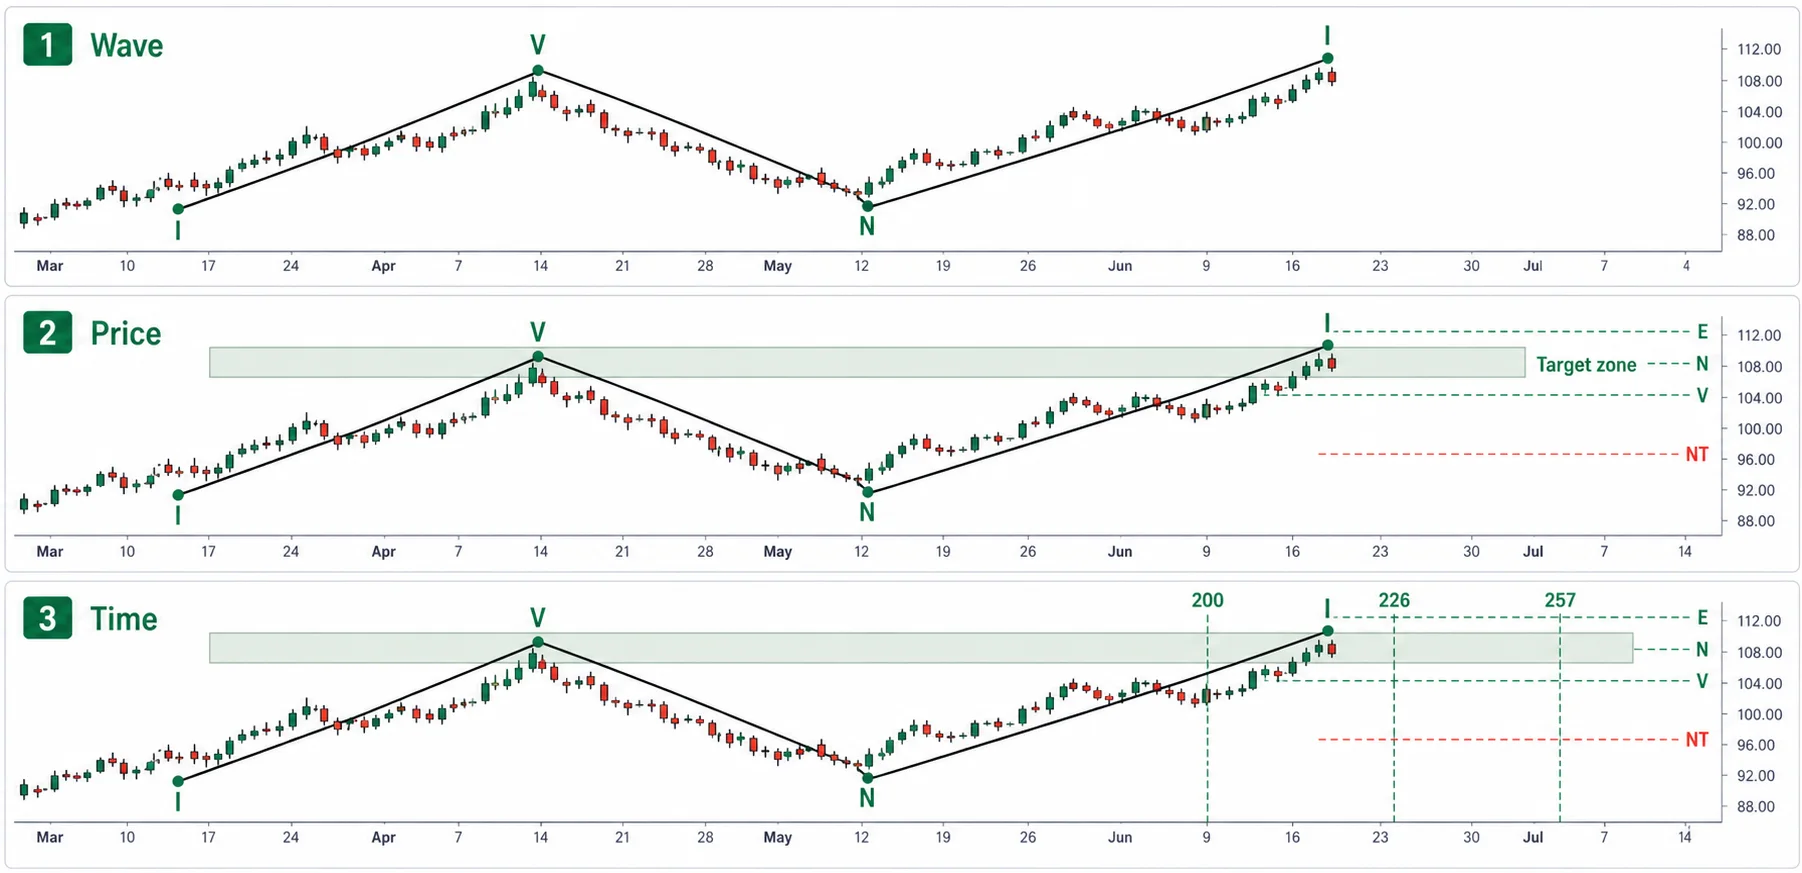
The order matters because each stage feeds the next. You have to fix your position with the waves before you can decide which A, B, and C to draw the targets from. The targets have to produce a target price zone before you can line up the moment price reaches it against a change day. Start from the change days instead and you end up counting dates without knowing which price you are waiting for.
Confluence means all three meet at a single spot
Confluence is when the price-target zone, the time-theory change day, and the N-wave completion all meet at one spot and one moment. In price, the spot where the four targets cluster; in time, the change day; in form, the moment the last leg of the N breaks the prior extreme — these three overlap.
When all three meet at the same place, you raise your confidence a notch. The price target says where price is likely to stall, time theory says the moment it reaches that spot is a day prone to reversal, and the N completion says the form has finished one unit of trend. The three pillars point to the same single spot on different grounds. Only at a spot like this do you confirm an entry or an exit.
When change days overlap with one another, the weight is greater still. When a change day counted from one origin and a change day counted from a different origin land on the same date, that day is a strong turn candidate that several time calculations have singled out together. Just as an overlapping value is strong in price targets, an overlapping change day is strong in time. When reading confluence, treat the spot where a price-on-price overlap and a change-day-on-change-day overlap meet again at one point as the spot of highest confidence.
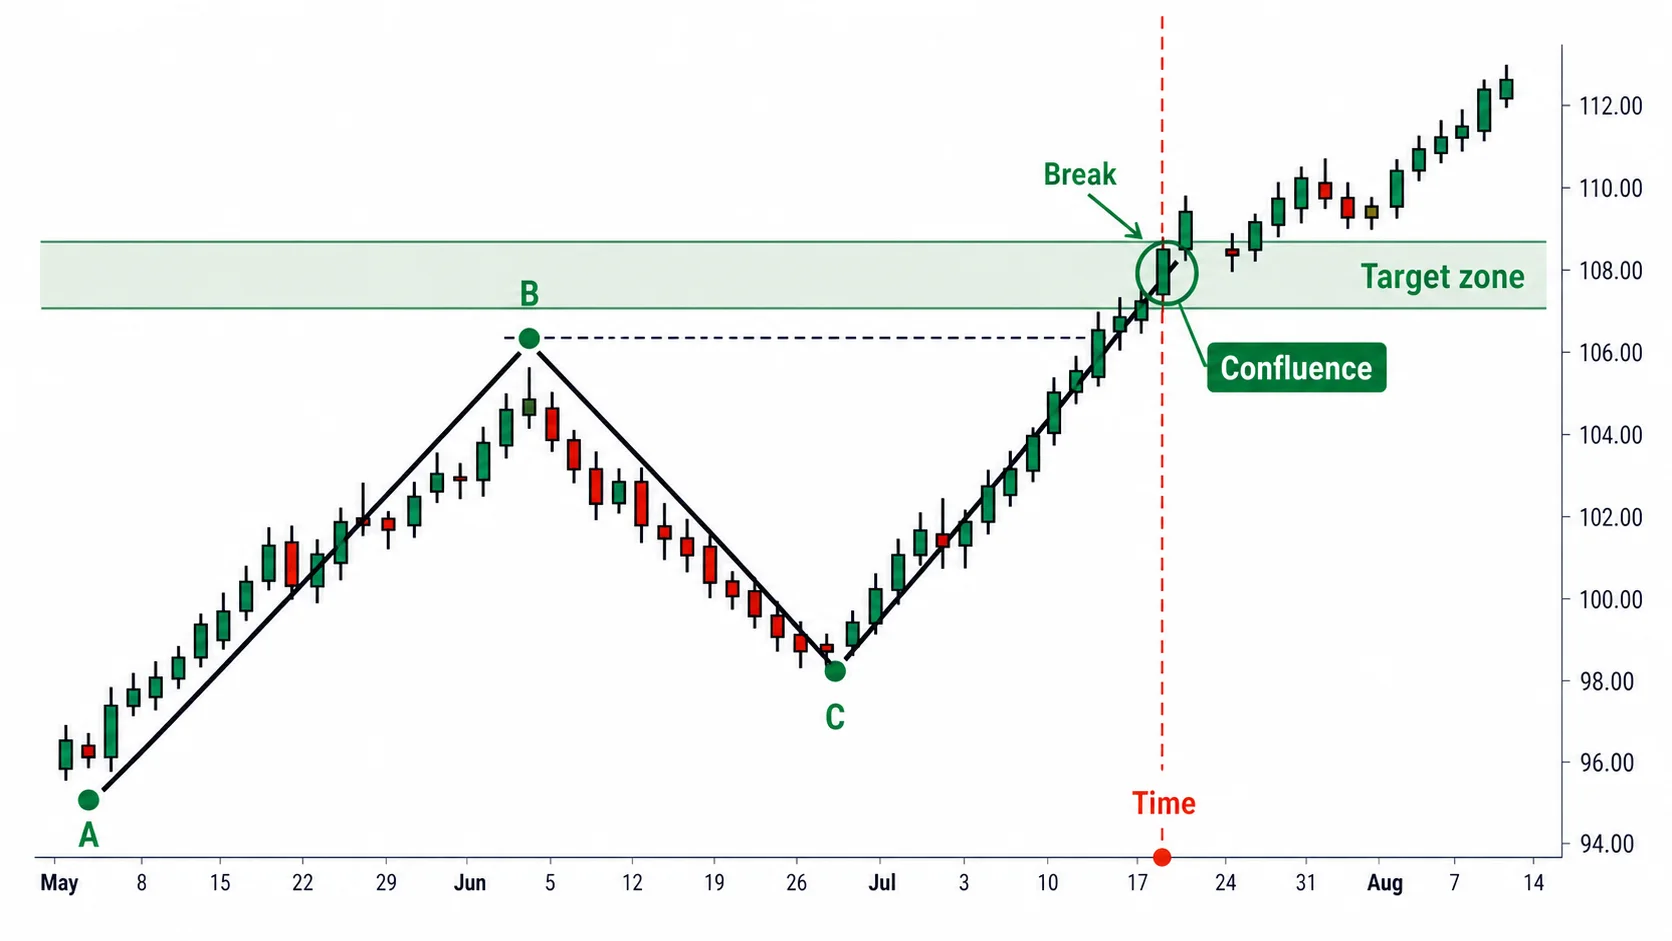
Confluence spots do not appear often, because it is rare for all three conditions to line up at once. And because they are rare, each one carries all the more meaning when it does appear. Ichimoku is not a tool for finding an entry on every bar. You wait until a confluence sets up.
When only two of the three line up, stand aside or cut your size
The three pillars do not always overlap neatly. Price may have reached the spot where the four targets cluster, yet that day may be far from a change day. The change day may be right, yet the third leg of the N may not yet have broken the prior high.
When two line up like this and one is missing, do not confirm. Stand aside, or if you do enter, cut your size. Your response changes depending on which condition is missing. If price has reached the target but the change day is far off, price may have arrived yet it may not be time to stall, so you wait a little longer. If the change day has come but the N is unfinished, the form has not ended and the trend still has room to run, so you wait for the completion.
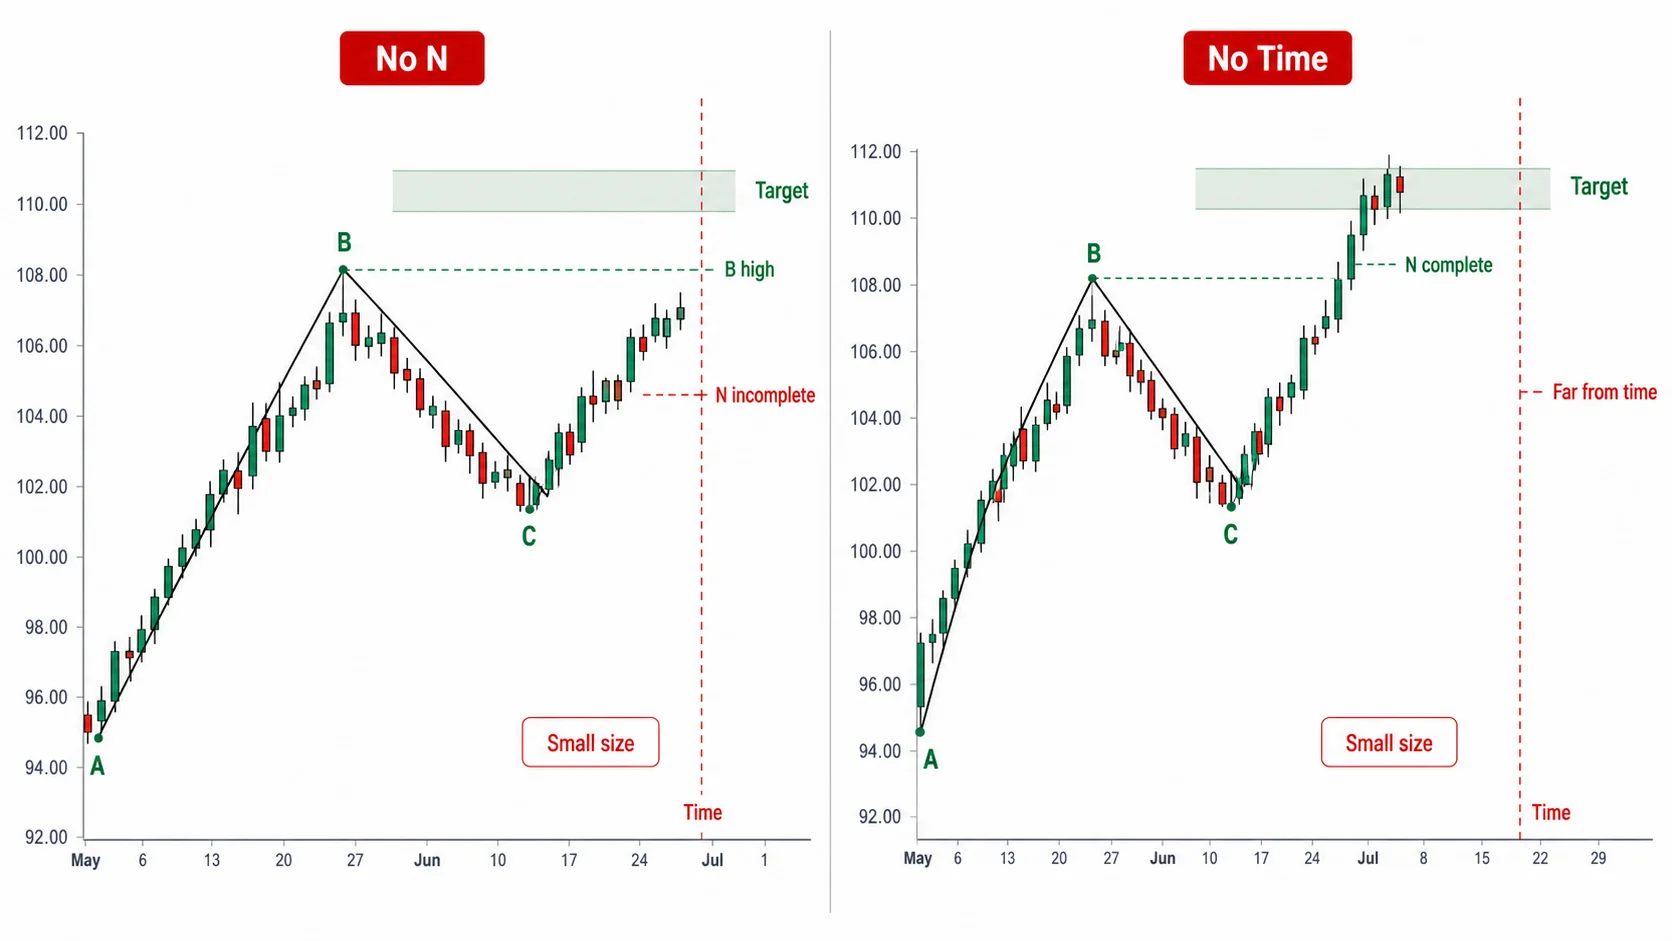
Force an entry when only two line up and you are at a spot with one less ground than where all three overlap. The odds of being stopped out rise accordingly. Taking confluence as your standard means the same thing as filtering out the two-only spots.
If price doesn't break on the change day, it turns; if it breaks, it accelerates
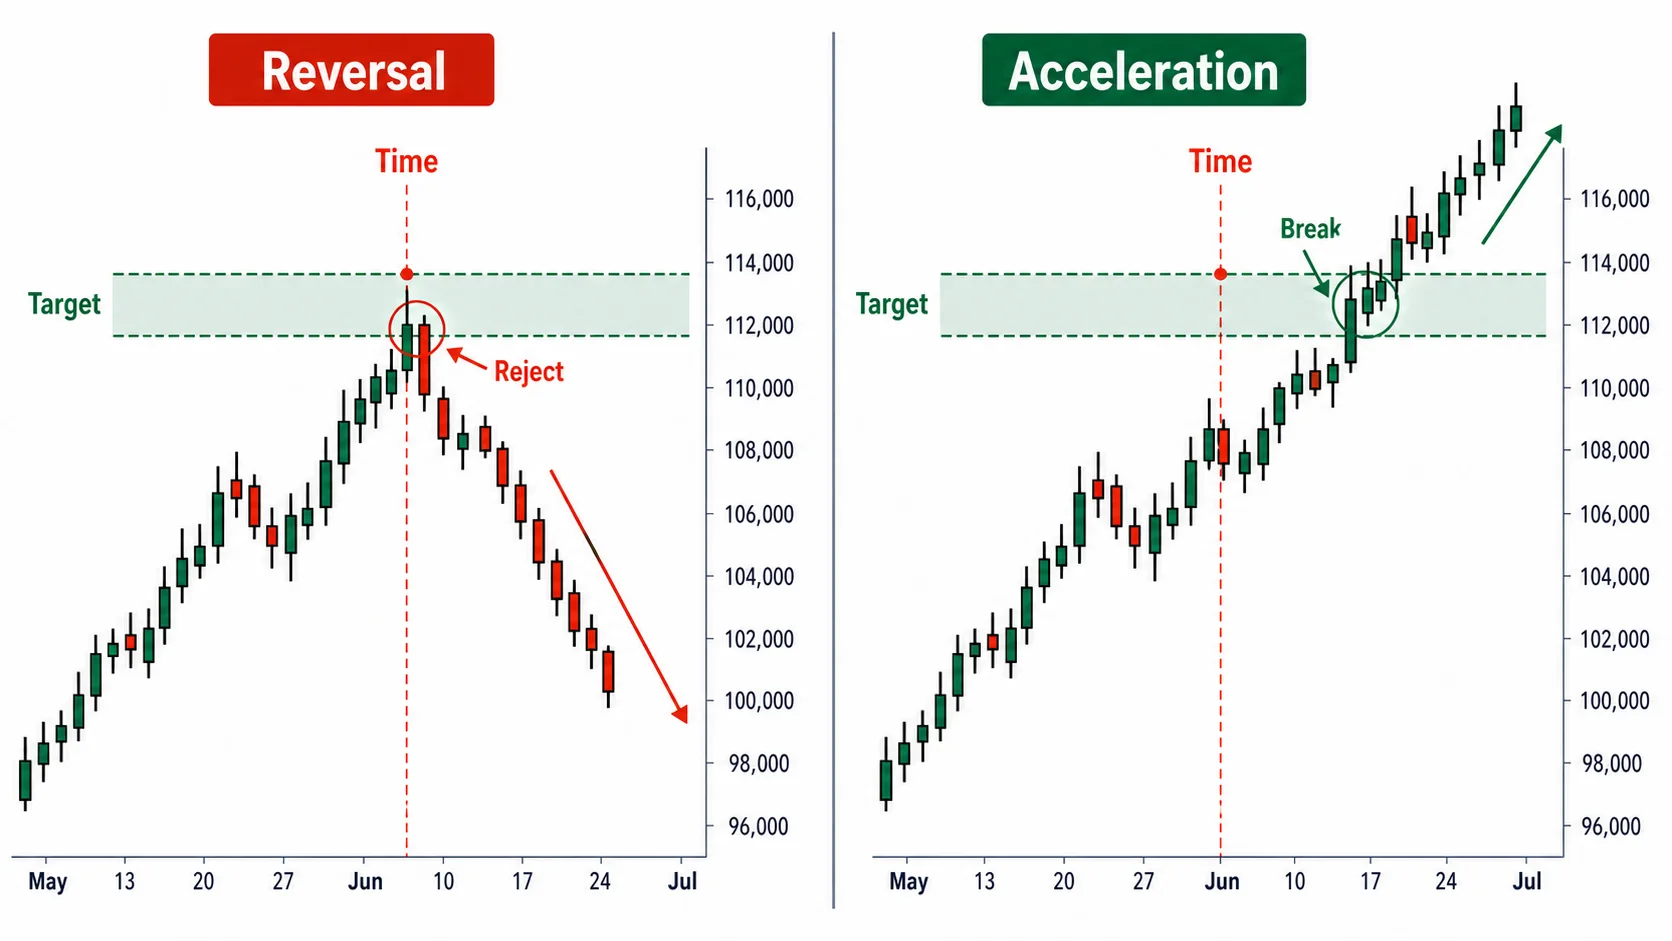
Even when price reaches a confluence spot, which way that day moves is not decided in advance. As covered in Part 11, a change day carries two scenarios at once: a reversal and an acceleration. The same confluence spot splits into a reversal branch and an acceleration branch depending on how price reacts.
If price is capped at the target zone on the change day and the last leg of the N fails to break the prior high, read it as a reversal. The moment has passed while the form failed to complete, so the trend bends here. If instead price clears the target zone on a closing basis on the change day and the N completes cleanly, read it as an acceleration. Price has passed both the spot and the moment where it might have stalled, so the trend advances one stage further.
So at a confluence spot you prepare both scenarios in advance. If price is capped at the target and reacts on the change day, it is the bearish setup; if it clears the target and completes the N, it is the bullish setup. Fix on only one scenario and your response is late when price moves the other way.
Confluence setups organized by spot
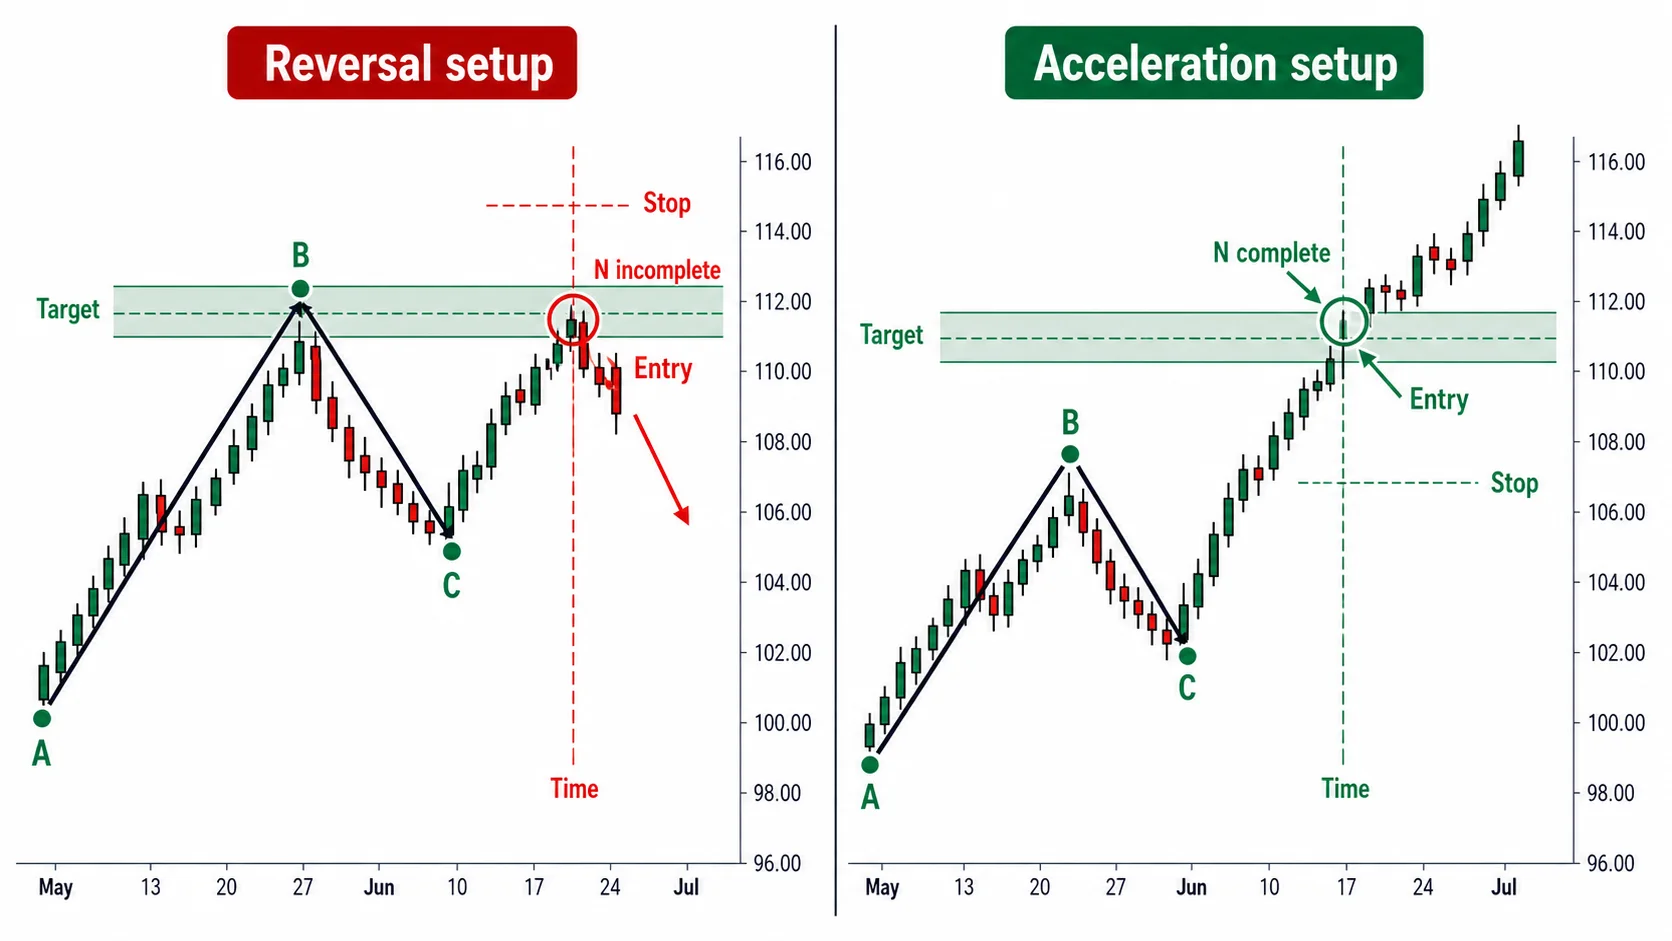
Below are confluence setups using a hypothetical, simple swing as an example. Assume an upward N that rises from a trend-start low A, makes a high B, pulls back to a low C, and then advances again.
First, the bearish setup. Price has risen to the target zone where the N target and the V target cluster, and the moment it reaches that spot overlaps with the 26th-bar change day counted from the origin.
- Entry: Confirm that price is capped at the target zone, turns down with a bearish bar on the change day, and that the third leg of the N ultimately fails to clear the prior high B on a closing basis, then enter short.
- Stop: Place it above the target zone, at the spot where price has cleared B on a closing basis. A break of B means the N has completed and turned into an acceleration, which collapses the premise of the reversal.
- Invalidation: If price passes the change day without being capped at the target zone and the N completes, the bearish setup does not hold. Stop watching this spot and switch to the bullish scenario.
Next, the bullish setup. On the same chart, price has cleared the target zone on a closing basis, the N has completed, and it has passed through the change day.
- Entry: Confirm that the N has cleared the prior high B on a closing basis and completed, and that the break overlaps with the change day, then buy in the direction of the trend.
- Stop: Place it below the target zone that was broken, above the pullback low C. If price returns to the break spot, the acceleration was false.
- Invalidation: If price returns below the target zone on a closing basis right after the break, the bullish setup does not hold. Do not chase a break that gives back the prior extreme. Where it returns to, measure the reversal possibility again, and if a change day and an unfinished N line up, move on to the bearish setup.
A sell-side confluence is the same picture with only the direction flipped. In a downward move, take a downward N that falls from a high A, makes a low B, retraces to a high C, and then falls again. The four targets are drawn into the target zone below, and when the moment price reaches that spot overlaps with a change day and the downward N breaks the prior low on a closing basis, it is a sell-side confluence. If the low is capped on the change day and the N is unfinished, prepare for an upward reversal; if it breaks cleanly, prepare for a downward acceleration.