OptiNod Academy
Ichimoku — Five Steps for One Swing
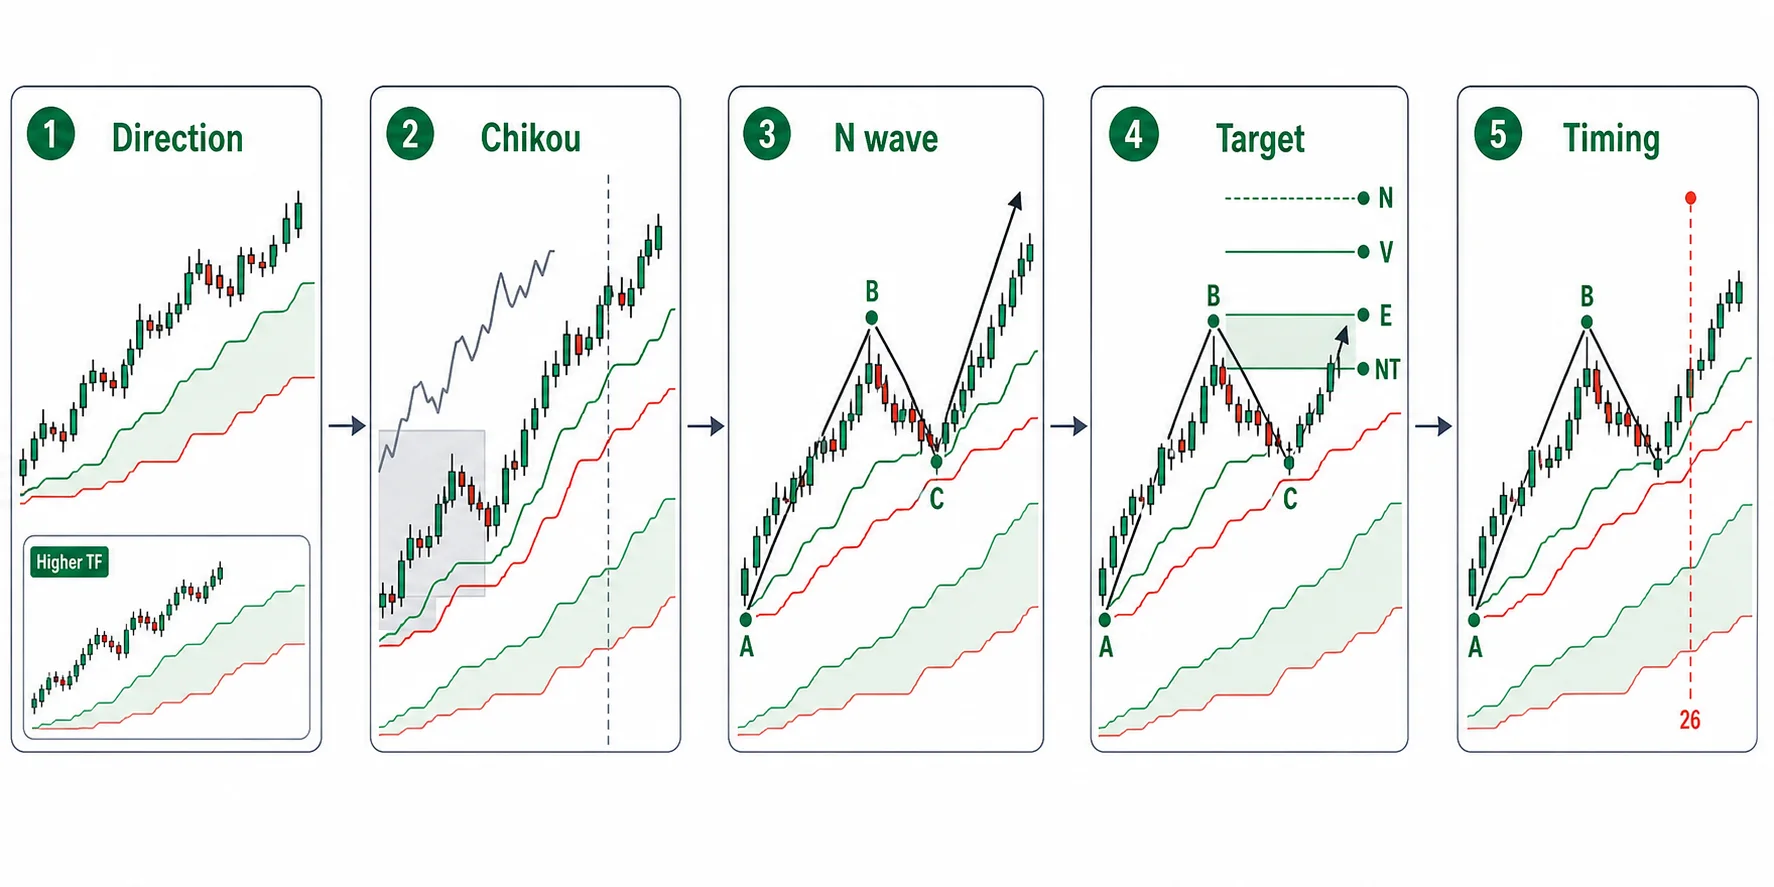
The higher-timeframe cloud sets direction, the Lagging Span confirms eligibility, the N-wave fills the shape, price targets fix the goal, and the change day adds timing — one continuous swing from entry to exit.
Ichimoku doesn't ask you to guess. The higher-timeframe cloud sets the direction, the Lagging Span (Chikou) confirms eligibility, the wave fills in the shape, price-target theory fixes the target, and the change day adds the timing. Follow a single swing in this order and one chart carries you from entry to exit without a break.
The five steps that complete one swing
Stack the tools this series has covered separately onto a single trade in order, and Ichimoku Kinko Hyo turns into one continuous workflow. There are five steps: set the direction, confirm eligibility, fill in the shape, fix the target, and add the timing.
The order runs as follows. The higher-timeframe cloud (Kumo) sets the direction. Eligibility comes down to whether the Lagging Span has cleared the price zone of 26 bars ago. Shape comes down to whether the N-wave of wave theory (Hadō-ron) has completed by breaking the prior extreme. The target is fixed with the formulas of price-target theory (Nehaba Kansoku). Timing comes from overlapping a time-theory change day with a price signal.
These five steps advance only once the previous step has passed. Where the direction is undecided you don't test eligibility, and where there's no eligibility you don't calculate a target. What follows is a hypothetical, simplified case with no real instrument or numbers attached, tracing how the five steps connect across a single swing.
The higher-timeframe cloud sets the direction
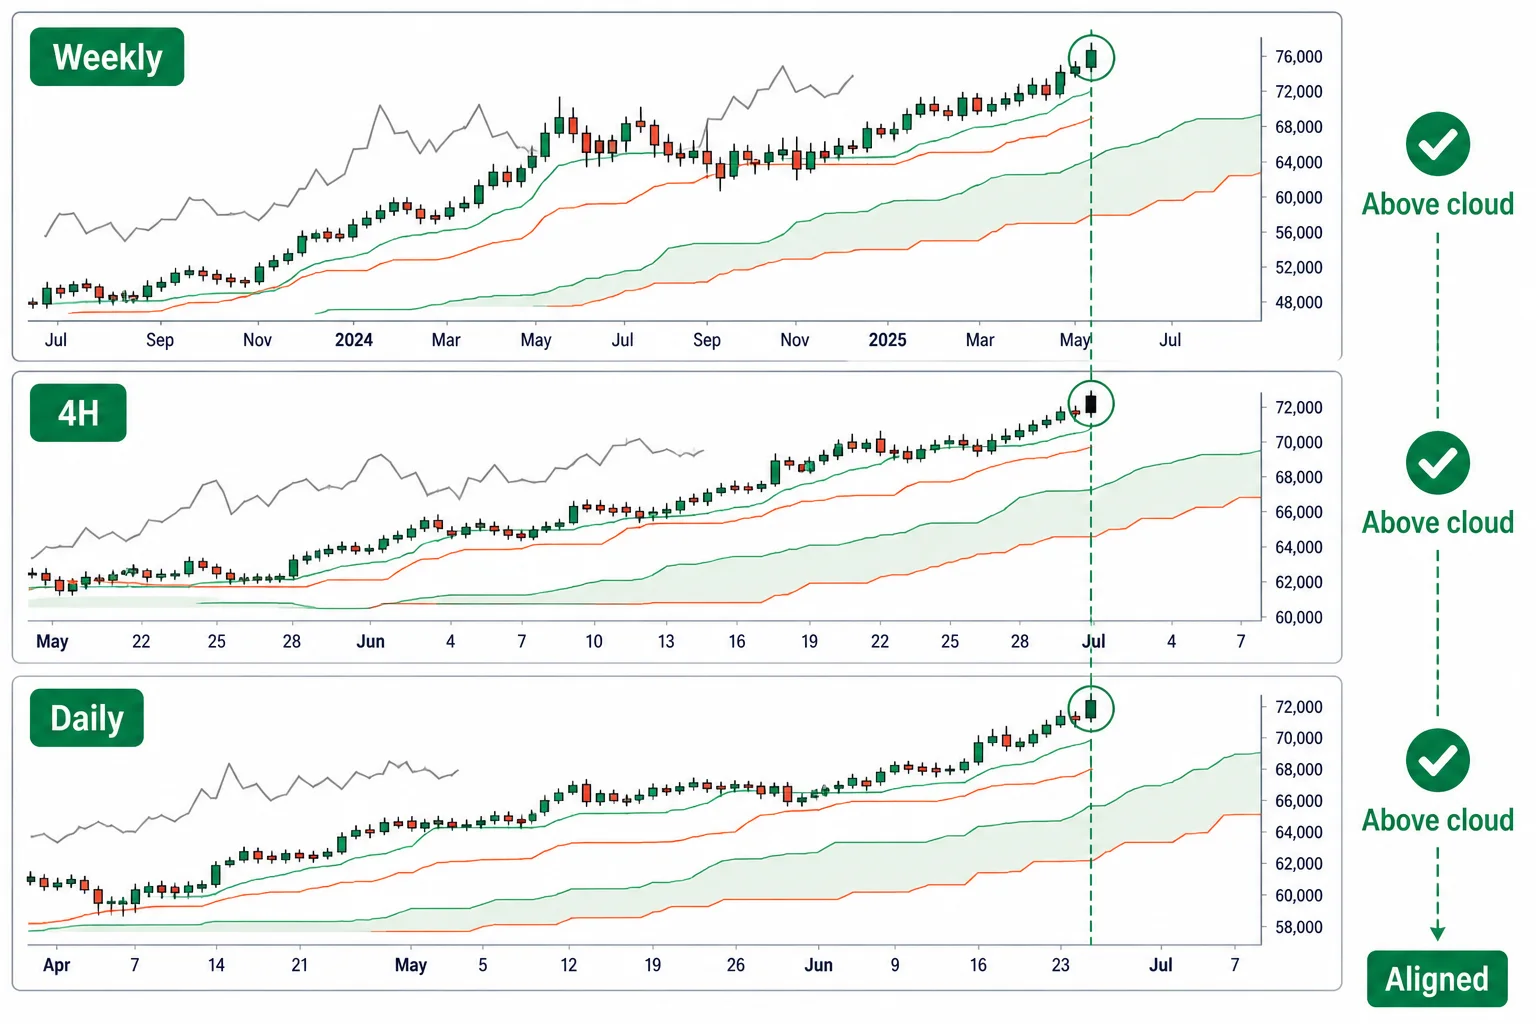
The first step is to fix the direction one level above the timeframe you trade. If you trade the daily, you look at the weekly cloud first. When weekly price sits above the cloud you look only for longs, and below the cloud you look only for shorts. When weekly price is inside the cloud the higher direction isn't decided yet, so you leave that asset alone.
The reason for fixing direction with the higher-timeframe cloud is that a large share of lower-timeframe signals are counter-trend, running against the higher trend. As Part 7 covered, lower signals aligned with the higher cloud ride the trend, while signals that diverge often run into the higher trend and get turned back. Fixing the direction first sets up a filter that screens out the diverging signals.
Once the direction is fixed, don't skip a step on the way down to the trading timeframe. You set direction on the weekly and find the entry on the daily, but you keep the 4-hour between them as an intermediate step. Even if the weekly is long, if the 4-hour price has dropped deep below the cloud you hold off on the daily entry. When the 4-hour climbs back above the cloud and matches the weekly direction, you test the daily setup. The firmest position is one where all three timeframes — higher, intermediate, and lower — line up in the same direction.
You don't throw out every lower signal that diverges from the higher-timeframe cloud. You treat it as counter-trend and either reduce the entry size or skip it. If the weekly is above the cloud but a short signal appears on the daily, that short runs against the higher trend, so you don't enter it at normal size.
The Lagging Span confirms eligibility
Once the direction is set to long, the next step is to check whether the daily setup has earned its eligibility. This is the spot where price rises above the cloud and the bullish turn — Conversion Line (Tenkan-sen) crossing above Base Line (Kijun-sen) — comes together. You score the three conditions of the three-role bullish reversal (Sanyaku) covered in Part 5 by adding up points.
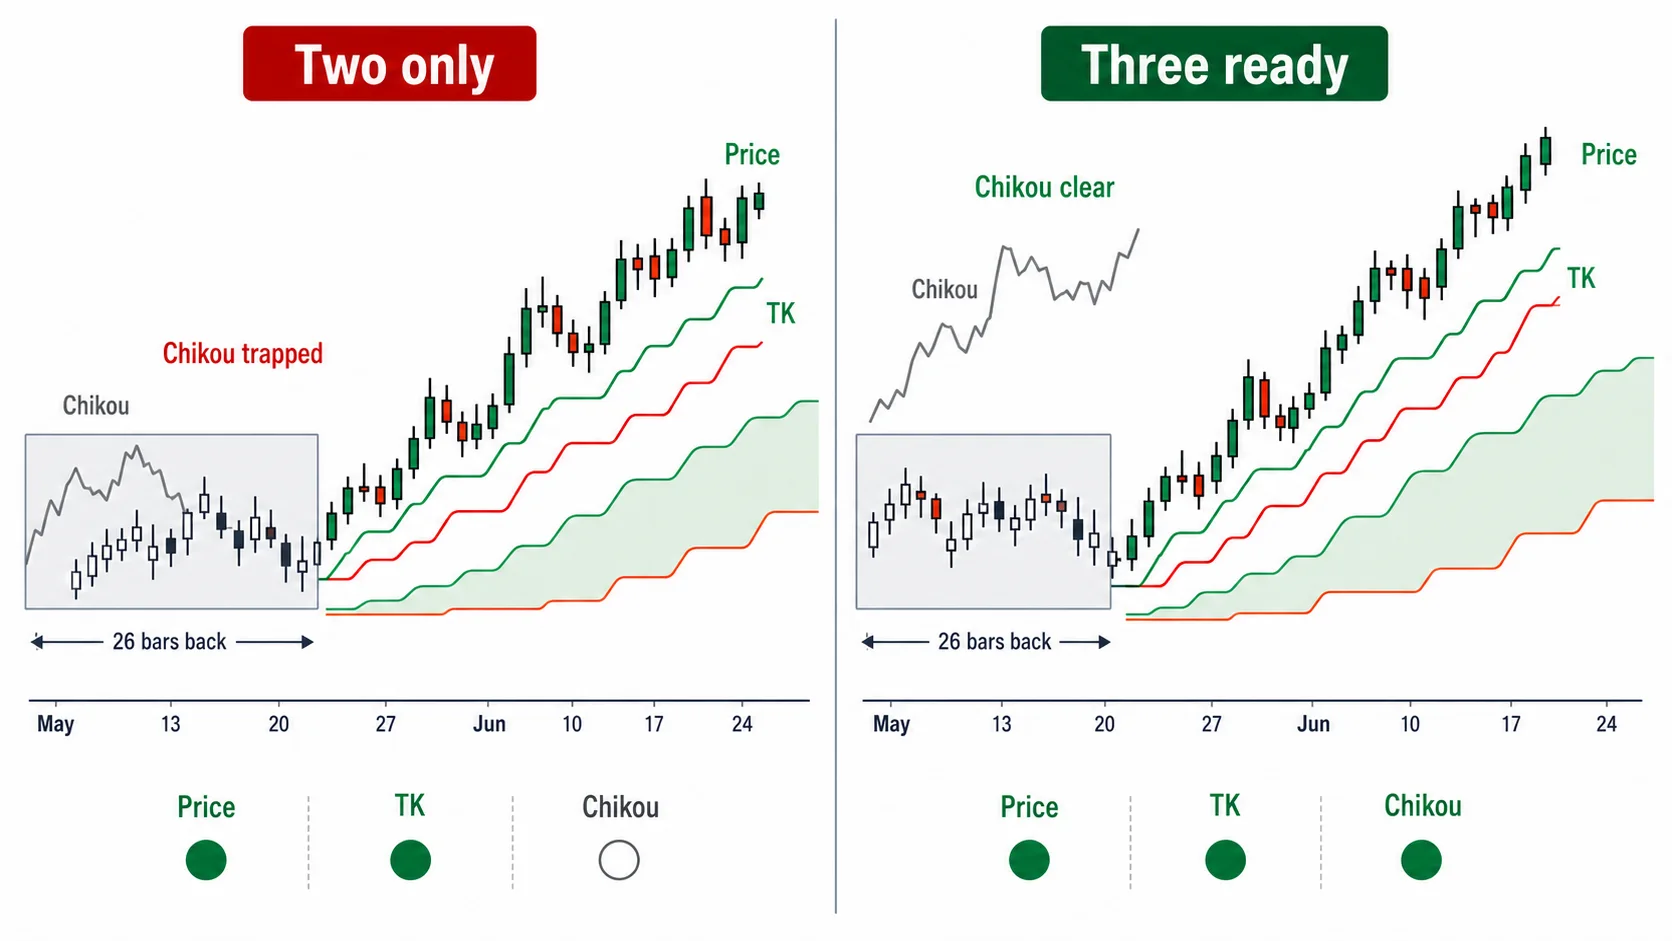
The three conditions are the balance-table bullish turn, the lagging bullish turn, and the cloud bullish turn. The Conversion Line rising above the Base Line is the balance-table bullish turn; the Lagging Span clearing above the price zone of 26 bars ago is the lagging bullish turn; price closing above the cloud is the cloud bullish turn. Counting each condition as one point, one point is a weak signal, two points is a signal worth considering for entry, and a three-role bullish reversal with all three points filled is the strongest signal. Price merely clearing the cloud is only one point, so that alone is not a three-role bullish reversal.
The three turns usually appear in this order: the balance-table turn first, the lagging turn next, and the cloud turn last. That's the typical pattern, though, and there are exceptions. When price surges quickly, the cloud turn can appear before the lagging turn. So you don't treat the order as a fixed condition; you treat eligibility as whether all three points are filled.
In this step you use the Lagging Span as an eligibility test. As Part 3 covered, the Lagging Span is today's close shifted 26 bars back, so the lagging bullish turn only stands when it rises cleanly above the price zone of the bar 26 bars ago. If price is above the cloud and the Conversion Line is above the Base Line but the Lagging Span alone is trapped inside the price zone of 26 bars ago, only two points are filled and the setup is still incomplete.
When you read the Lagging Span, you also check whether there's supply overhead at the 26-bar-ago position that could block it. If a large candle or a thick band of supply has built up at the 26-bar-ago spot the Lagging Span passes through, then even with the lagging bullish turn in place, the Span is likely to stall in front of that volume. If the 26-bar-ago spot is open space and the Lagging Span floats through unobstructed, there's no supply to press it down from above, and the eligibility is firmer.
The N-wave fills in the shape
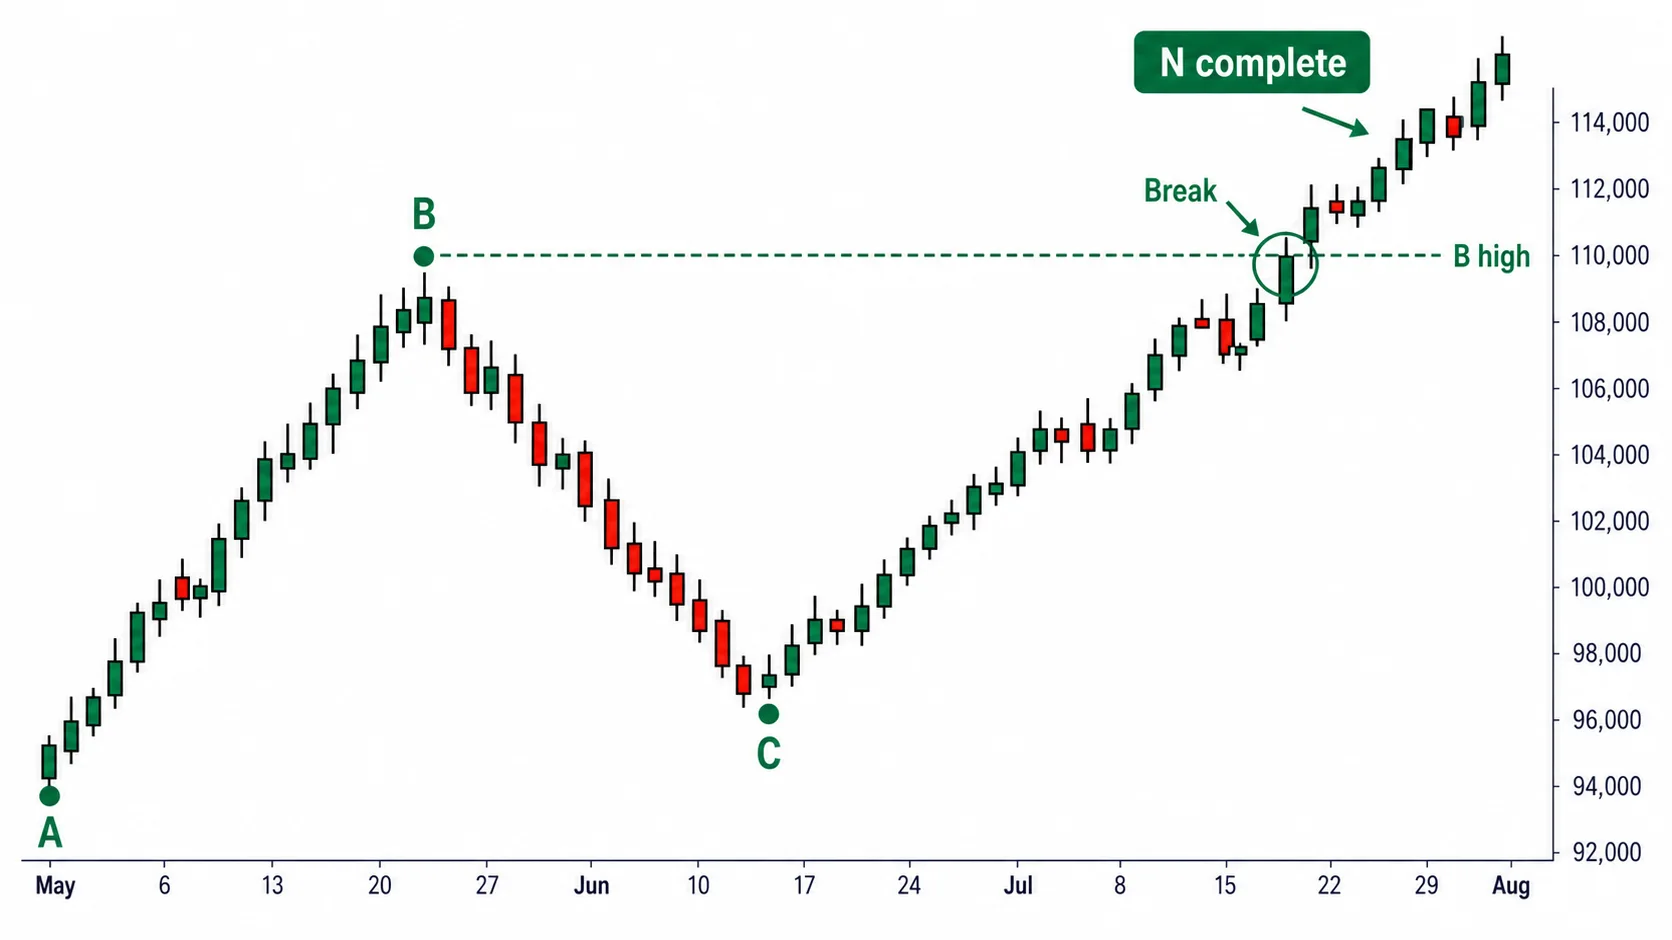
Even when all the turns are in place, whether price has settled into a trend shape is a separate check. The N-wave of wave theory covered in Part 6 fills in this shape. Price rises from the starting low to a high (the advance), falls from that high to a pullback low (the retracement), then rises again to break the prior high — and the N completes.
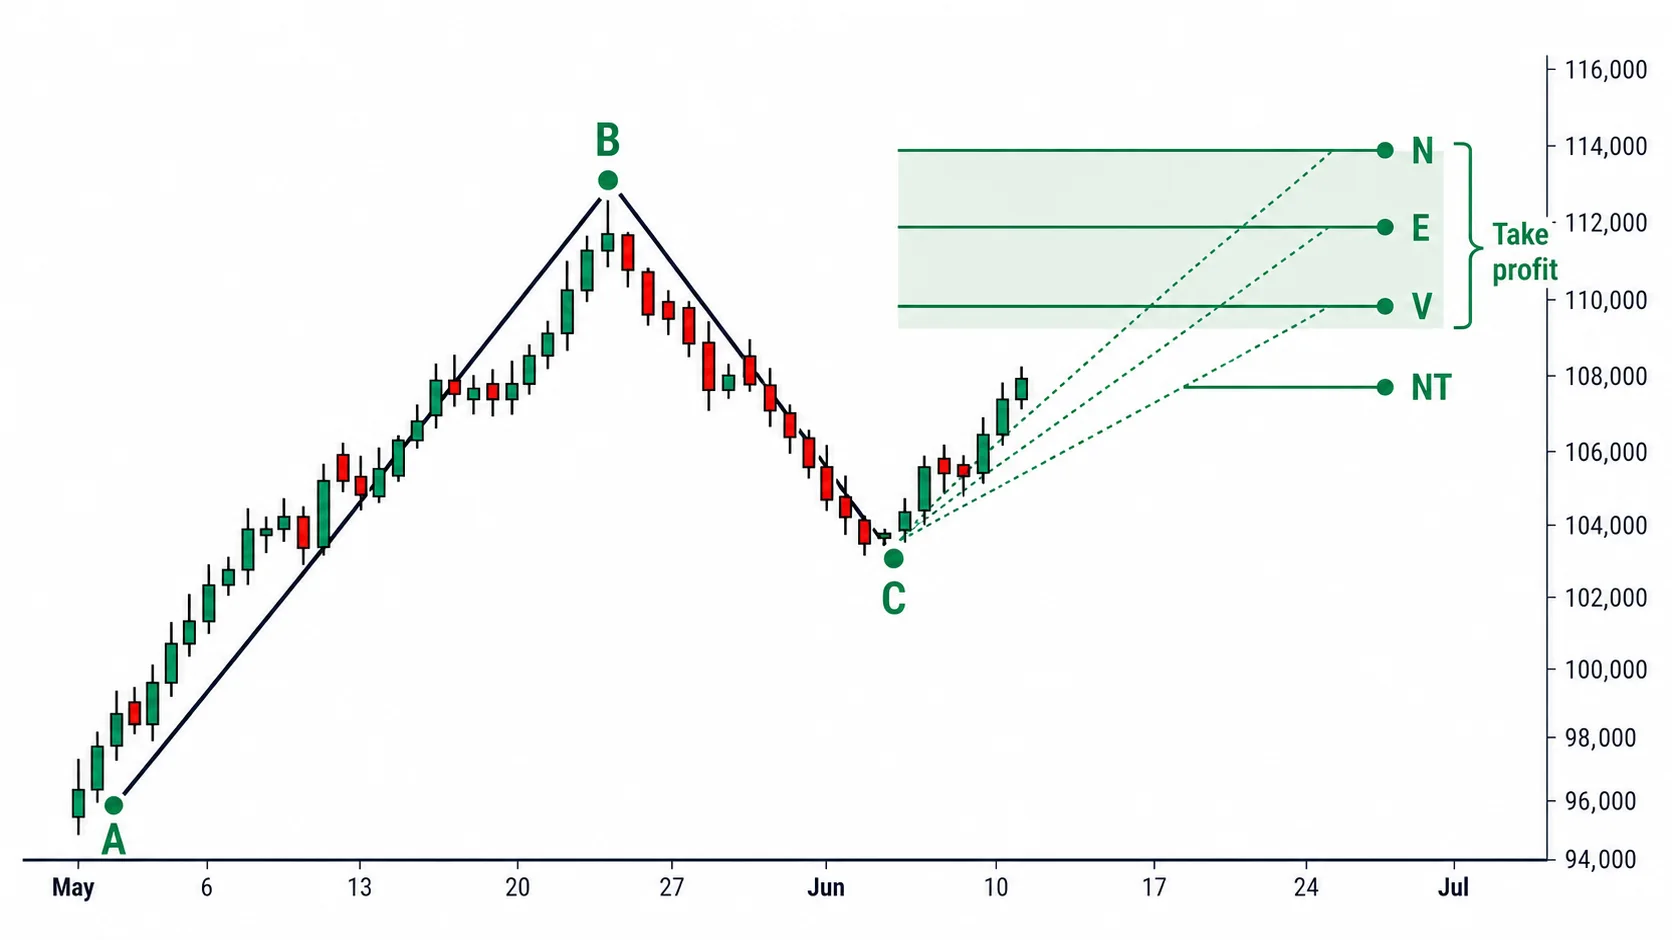
The key to completing the N is that the final move breaks the prior extreme. If the final advance stalls without exceeding the prior high, it stays a simple retracement and the N doesn't complete. Label the starting low A, the high B, and the pullback low C: the moment price rises from C and exceeds B, the N stands.
In this step, shape and eligibility back each other up. When price completes an N at the spot where the lagging bullish turn stands, the move that cleared the price zone of 26 bars ago and the shape that broke the prior high point the same way. If only one of the two stands, the setup still has one side unfilled.
Price-target theory fixes the target
Once the N completes, you calculate the target with the same A, B, and C. You use the four formulas of price-target theory (Nehaba Kansoku) covered in Part 9. A is the starting low, B is the high, and C is the pullback low.
- N target: C + (B − A). The first advance range raised again from C.
- E target: B + (B − A). The first advance range stacked once more above B.
- V target: B + (B − C). The pullback range returned above B.
- NT target: C + (C − A). The range from A to C added on top of C.
These four values aren't targets guaranteed to be reached. You treat them as candidate values. As Part 13 covered, you don't fix a take-profit on a single value as a point; you treat the price zone where the four candidates cluster closely together as the take-profit zone. When several formulas point to the same spot, that zone becomes a firmer target.
A spot where a price-target candidate overlaps with a time-theory change day gains reliability, because the target fixed by price and the reversal candidate fixed by time point to the same place. The final step fills in this overlap with the change day.
The change day adds the timing
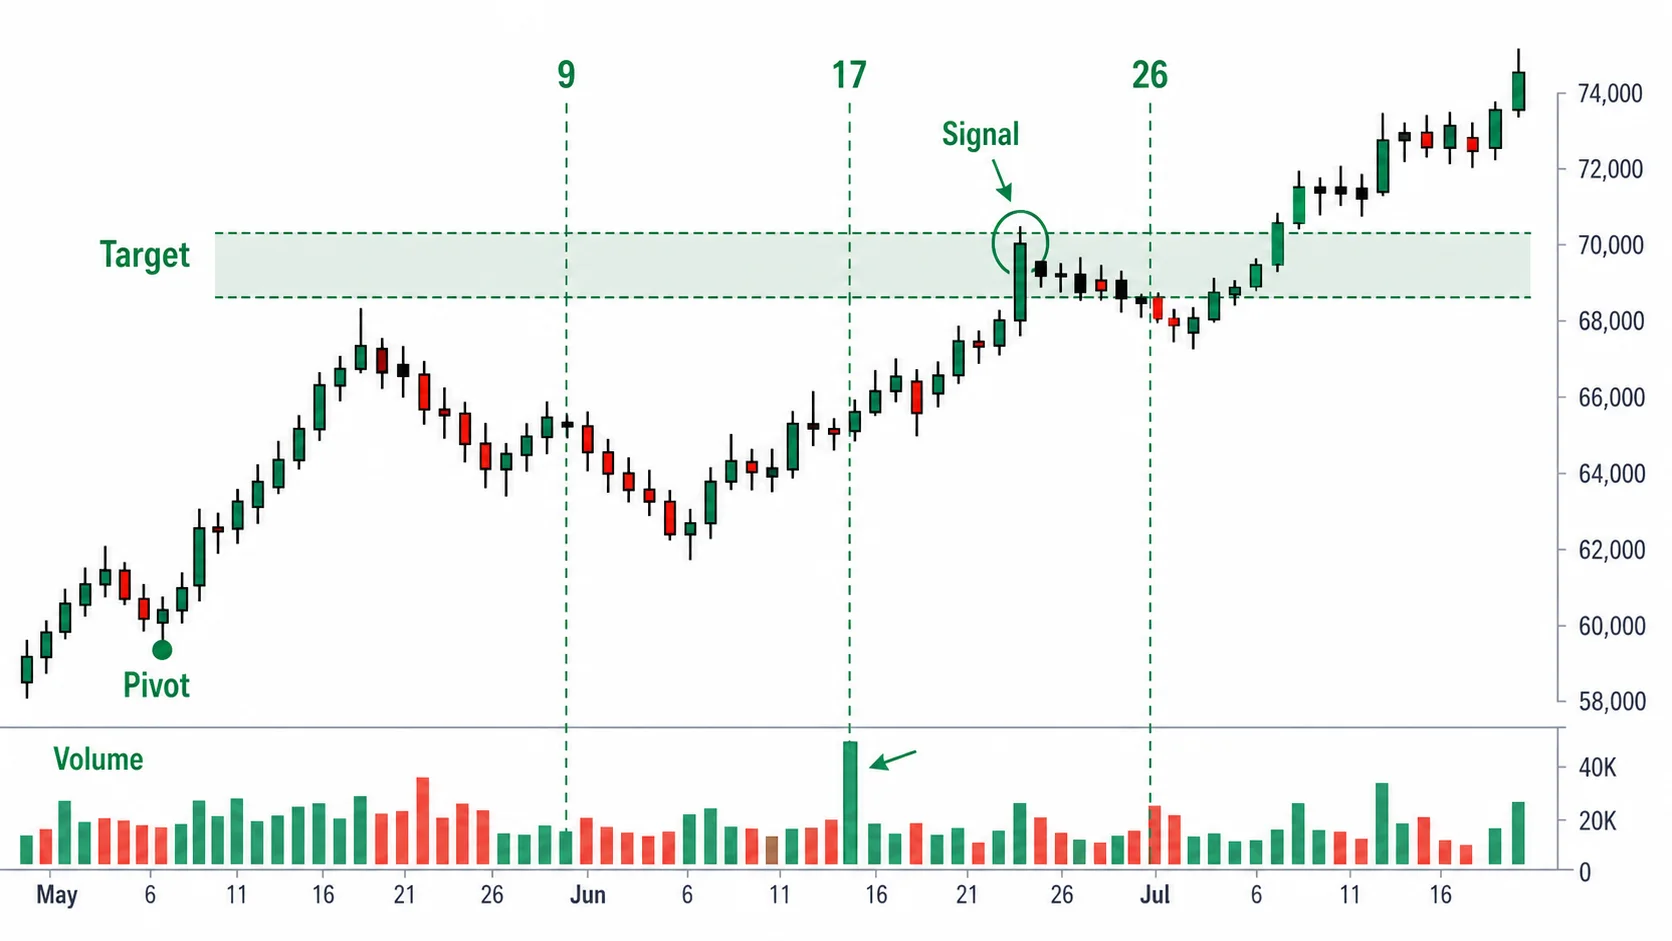
The final step is to lay on a time-theory change day. You count the basic numbers 9·17·26 covered in Part 10, and 76·226 above them, from the most recent turning point, and set candidate days in advance on which the trend may change. 17 comes out as 9×2−1, and 26 as 9×3−1.
A change day on its own is not an entry or exit signal. As Part 11 covered, the combinations of basic numbers are so numerous that a candidate falls on nearly every day, and confirmation bias creeps in when you remember only the ones that hit after the fact. Because it's a structure of multiple comparison and post-hoc selection, it's very hard to disprove quantitatively. You don't trade on a change day alone.
You adopt a change day only when a price signal comes with it. When price reaches a price-target candidate zone on a day that overlaps with a change day, and a price signal — a dead cross of the Conversion Line and Base Line, or a twist of the cloud — appears at that spot, you use it as grounds for an exit or a change of direction. If volume surges on the change day, or that spot overlaps with a large band of supply, you raise the reliability another step. When the same spot is singled out by both price and time and volume rides on it as well, that's the firmest spot, with three pieces of evidence gathered in one place. A change day that hit only on the date, with no price signal, is not used as grounds.
Hang the stop and take-profit on the structure
A position entered through the five steps hangs its exit on the Ichimoku structure as well. You don't set the stop at an arbitrary distance; you place it beyond the Base Line or the nearest cloud boundary. As Part 4 covered, the thicker the cloud the stronger the support and resistance, so you convert the stop distance through ATR and, where the cloud is thick, set the stop wider and reduce the size accordingly.
A trailing exit reads off a dead cross of the Conversion Line and Base Line, or price re-entering the cloud. You hold while price keeps trending above the cloud, and when the Conversion Line drops below the Base Line or price re-enters the cloud, the trend has bent, so you exit. When price reaches the price-target take-profit zone you trim a portion, and you hold the rest until the structure breaks.
The setup for the confluence case can be summarized as follows.
- Entry: Fix the direction to long above the weekly cloud, with the 4-hour aligned to the weekly direction, at the spot on the daily where all three conditions of the three-role bullish reversal are filled, the Lagging Span clears cleanly above the price zone of 26 bars ago, and the N-wave breaks the prior high.
- Stop: Beyond the Base Line or the nearest lower cloud boundary. Convert through ATR; the thicker the cloud, the wider the stop and the smaller the size.
- Take-profit: Partial exit in the price-target zone where the N/E/V/NT candidates overlap. If that zone overlaps with a change day and a price signal is present, increase the exit portion.
- Invalidation: If the Lagging Span is trapped again in the price zone of 26 bars ago, or price re-enters the cloud, or the Conversion Line drops below the Base Line, the setup is treated as broken.
A sell runs the same five steps in reverse. You score the three-role bearish reversal, the exact inverse of the long's three-role bullish reversal. The three conditions are the balance-table bearish turn (the Conversion Line dropping below the Base Line), the lagging bearish turn (the Lagging Span clearing below the price zone of 26 bars ago), and the cloud bearish turn (price closing below the cloud). A short entry is the spot where weekly price is below the cloud with the direction fixed to short, all three bearish turns are filled, price breaks below the prior low to complete an N, and the price target is calculated downward. The stop is placed above the Base Line or the nearest upper cloud boundary.
Strong in trends, shaky in ranges
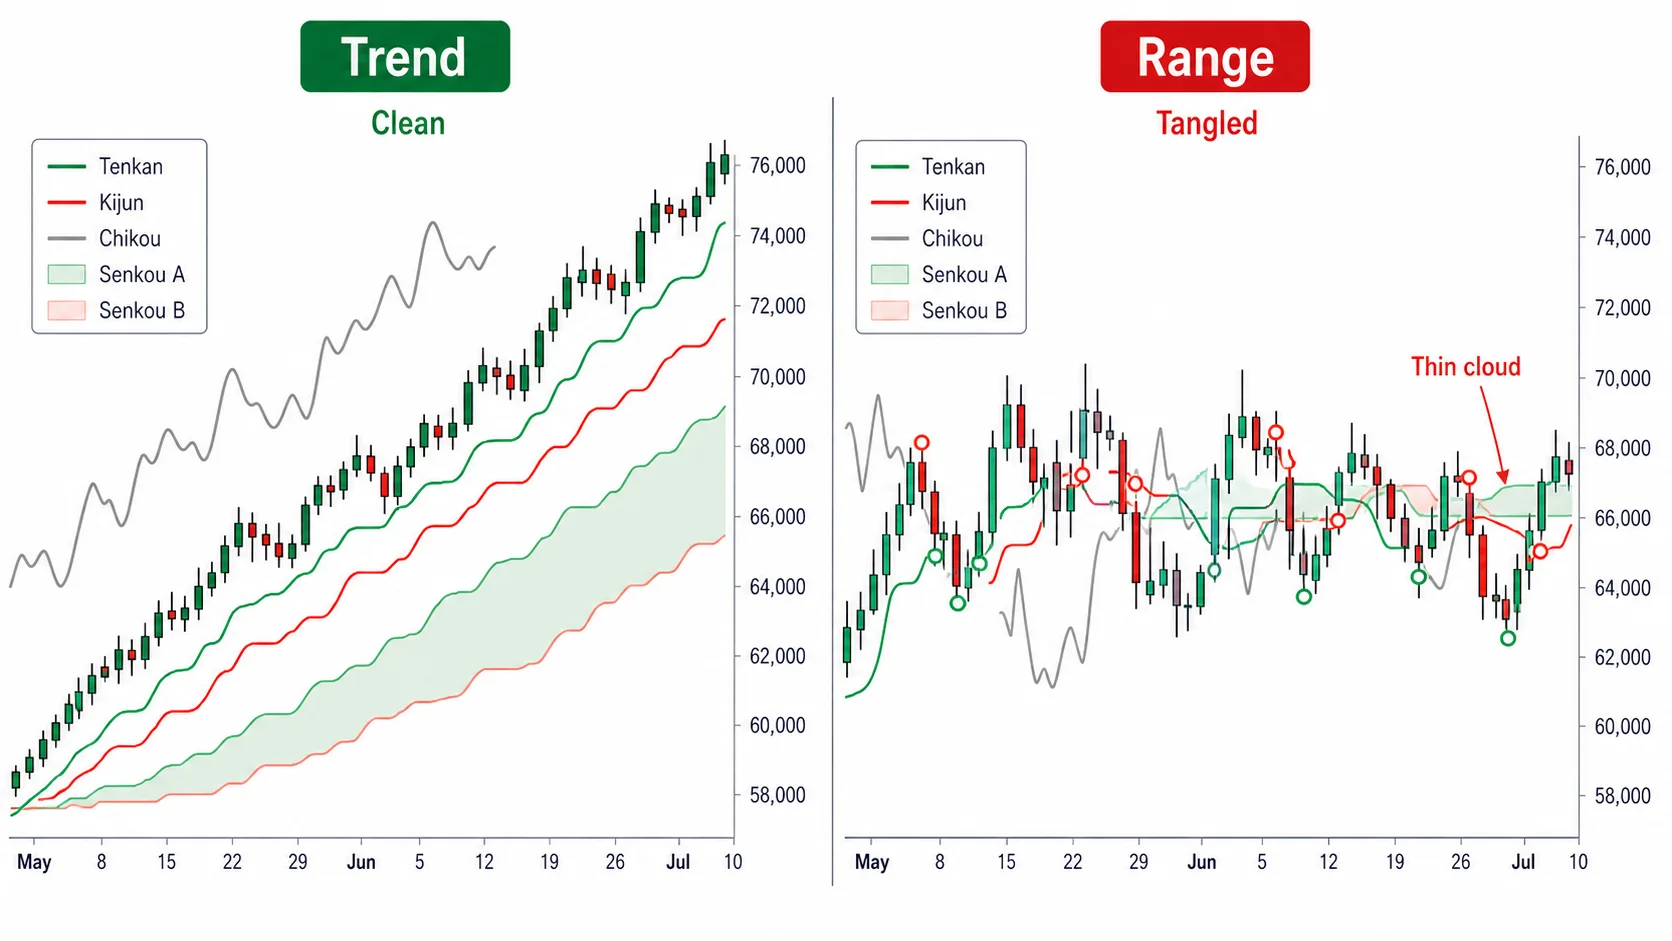
Even when all five steps line up, Ichimoku working has conditions. Ichimoku follows trends, so it's strong when price extends in one direction, and in a range that drifts up and down within a narrow band its signals turn into fakeouts. As Part 4 covered, in a range the cloud thins out and the Conversion Line, Base Line, and Lagging Span tangle with price, so bullish and lagging turns flicker on and off in short intervals.
So you keep a range check as a condition you clear before entering. When the cloud thins out and the five lines tangle in one spot, you switch off the Ichimoku signals and stand aside. You read cloud thickness against ATR and don't trade breakout signals in thin-cloud zones. The five steps run through in order only where a trend has settled in.
Don't generalize the claim that Ichimoku works across all assets and timeframes. Even under the same Ichimoku rules, performance is good on assets with a strong trending tendency and weaker on assets that frequently fall back into ranges. Fakeouts also surge on short, high-noise timeframes such as the 1-to-5-minute.
Look at the calendar before touching the defaults
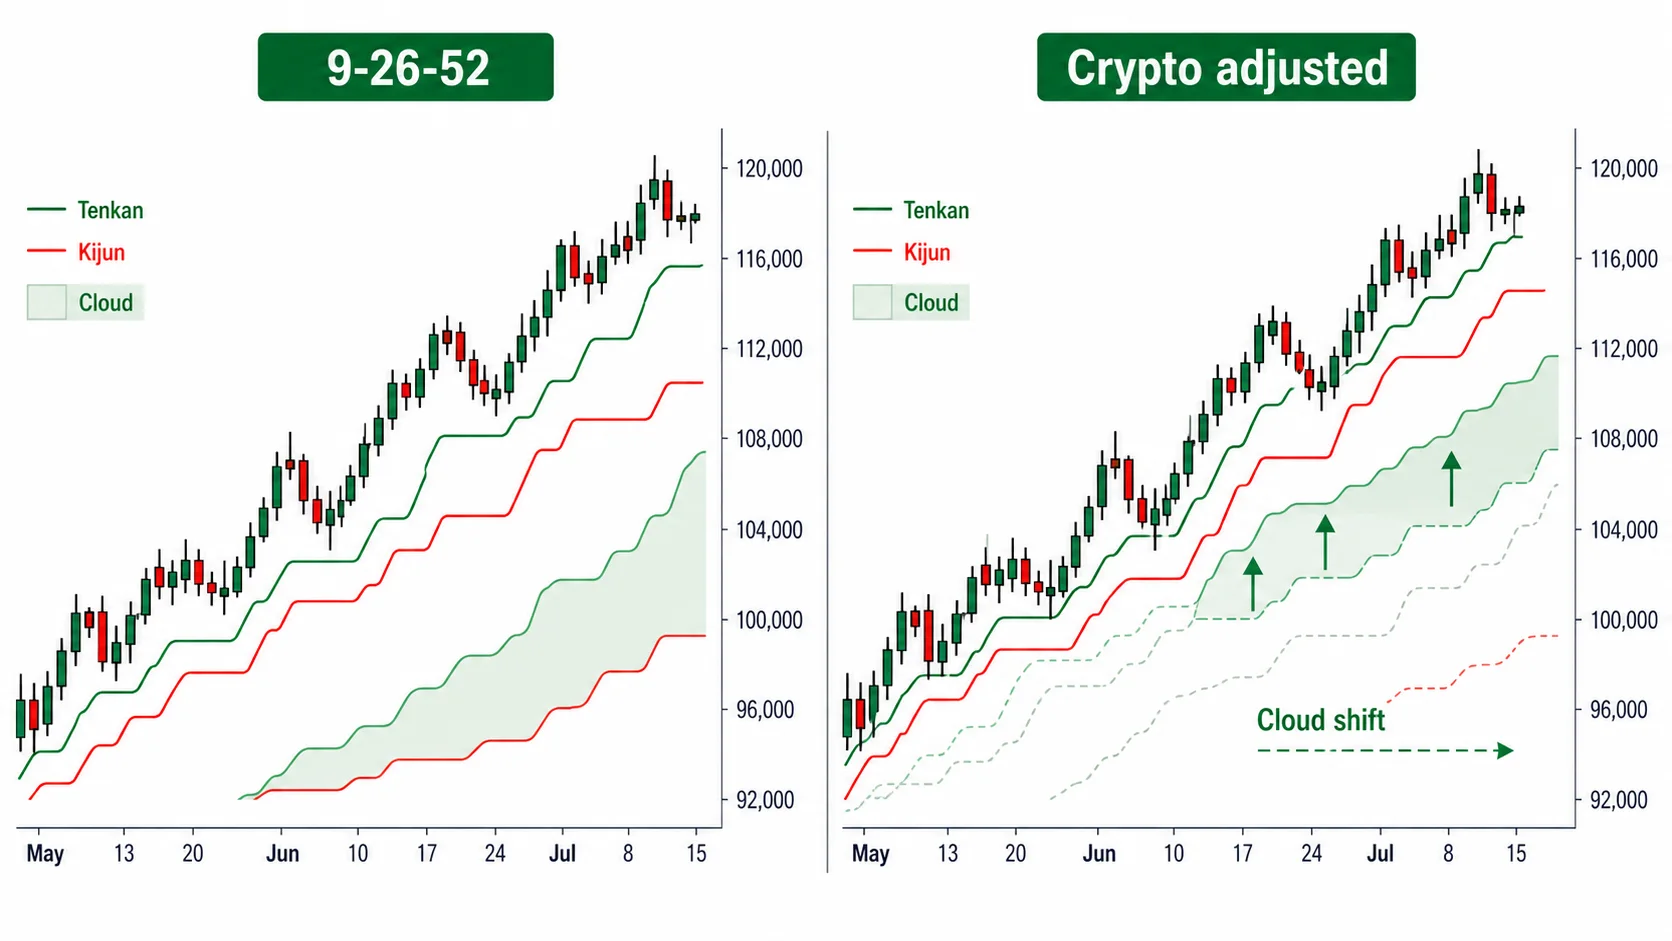
Finally, you decide whether to tune the 9·26·52 defaults to the asset. Before that, look at the asset's trading calendar first. As Parts 1 and 2 covered, 9·26·52 are numbers Goichi Hosoda set based on the trading days of an era when markets were open through Saturday, and 26 bars is commonly explained as one month of trading days. The orthodox reading, however, rejects the idea that these numbers came straight from the calendar. Stocks trade five days a week, FX trades 24 hours five days a week, and crypto trades 24 hours seven days a week, so the same 26 bars spans a different calendar period in each case.
On the crypto daily, 26 bars is exactly 26 days, but that doesn't match the trading-day unit Hosoda intended. So adjusted values such as 10-30-60, 20-60-120, and 7-22-44 have been proposed. There's also a counterargument, though, that changing the defaults throws off the 9·17·26 basic numbers and the 26-bar displacement of time theory together, scrambling the time axis. Both the common view and the counterargument have their grounds.
So you adopt an adjusted value only after comparison-backtesting it against the default. Rather than using the adjusted value alone, you run it side by side with 9·26·52 and confirm with price and cloud rules which side produces the better profit on that asset. Time-theory change days carry a post-hoc selection risk, so they're not used as the scoring criterion of this backtest; the decision is settled with price and cloud rules only.
Only a spot that has passed direction, eligibility, shape, target, and timing in this order counts as an entry. If even one step is empty, you wait at that spot. Using Ichimoku the way Hosoda laid it out means keeping the order of these five steps all the way through.