OptiNod Academy
Ichimoku — Why the Cloud Leads Price
The Kumo shifts today's values 26 bars forward, mapping the support and resistance ahead before price ever arrives.
The cloud sits ahead of price
As Part 1 showed, the cloud is the band between Leading Span A and Leading Span B. Both lines take the values computed today and shift them 26 bars to the right. That places the cloud ahead of current price, spread across a zone price has not yet reached.
Look at the right edge of the chart: the candles stop at today, but the cloud keeps extending beyond them. That extension is the cloud pre-drawn for the next 26 bars. On a daily chart it covers 26 days; on a 4-hour chart, 26 bars drawn ahead of price.
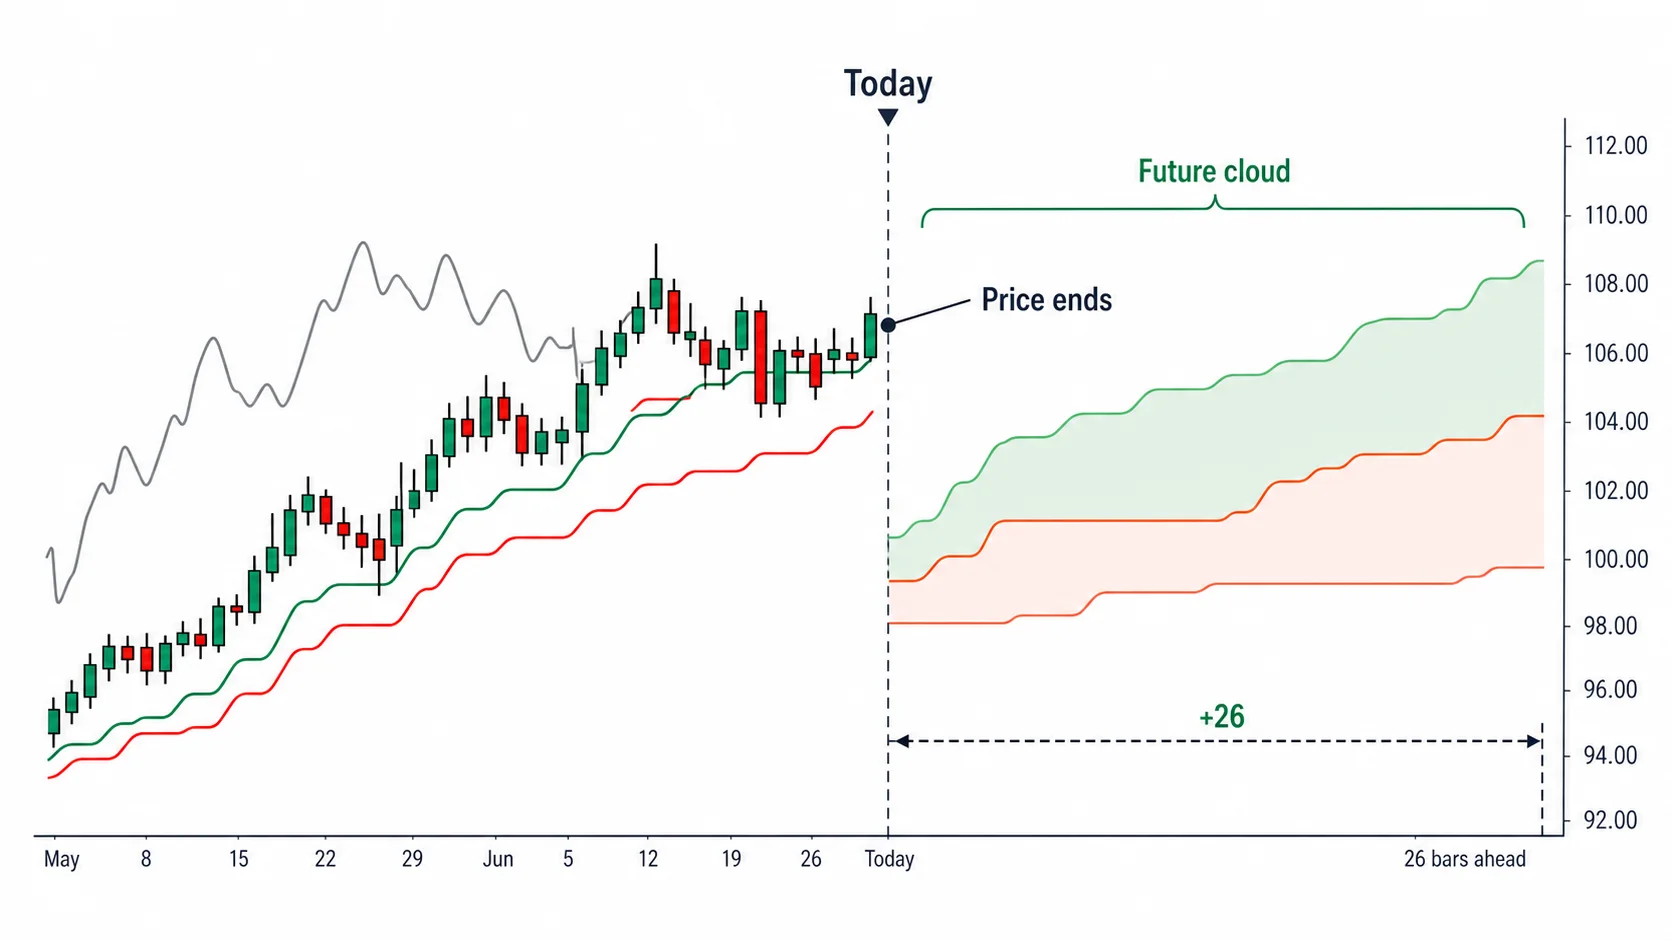
The two cloud boundaries move at different speeds. Leading Span A rises and falls relatively quickly because it follows the Conversion Line (Tenkan-sen) and the Base Line (Kijun-sen), while Leading Span B is much slower because it looks back over 52 bars. The future cloud is therefore drawn as a band of uneven width, shaped by one fast boundary and one slow boundary.
26 bars ahead, or 25 slots ahead
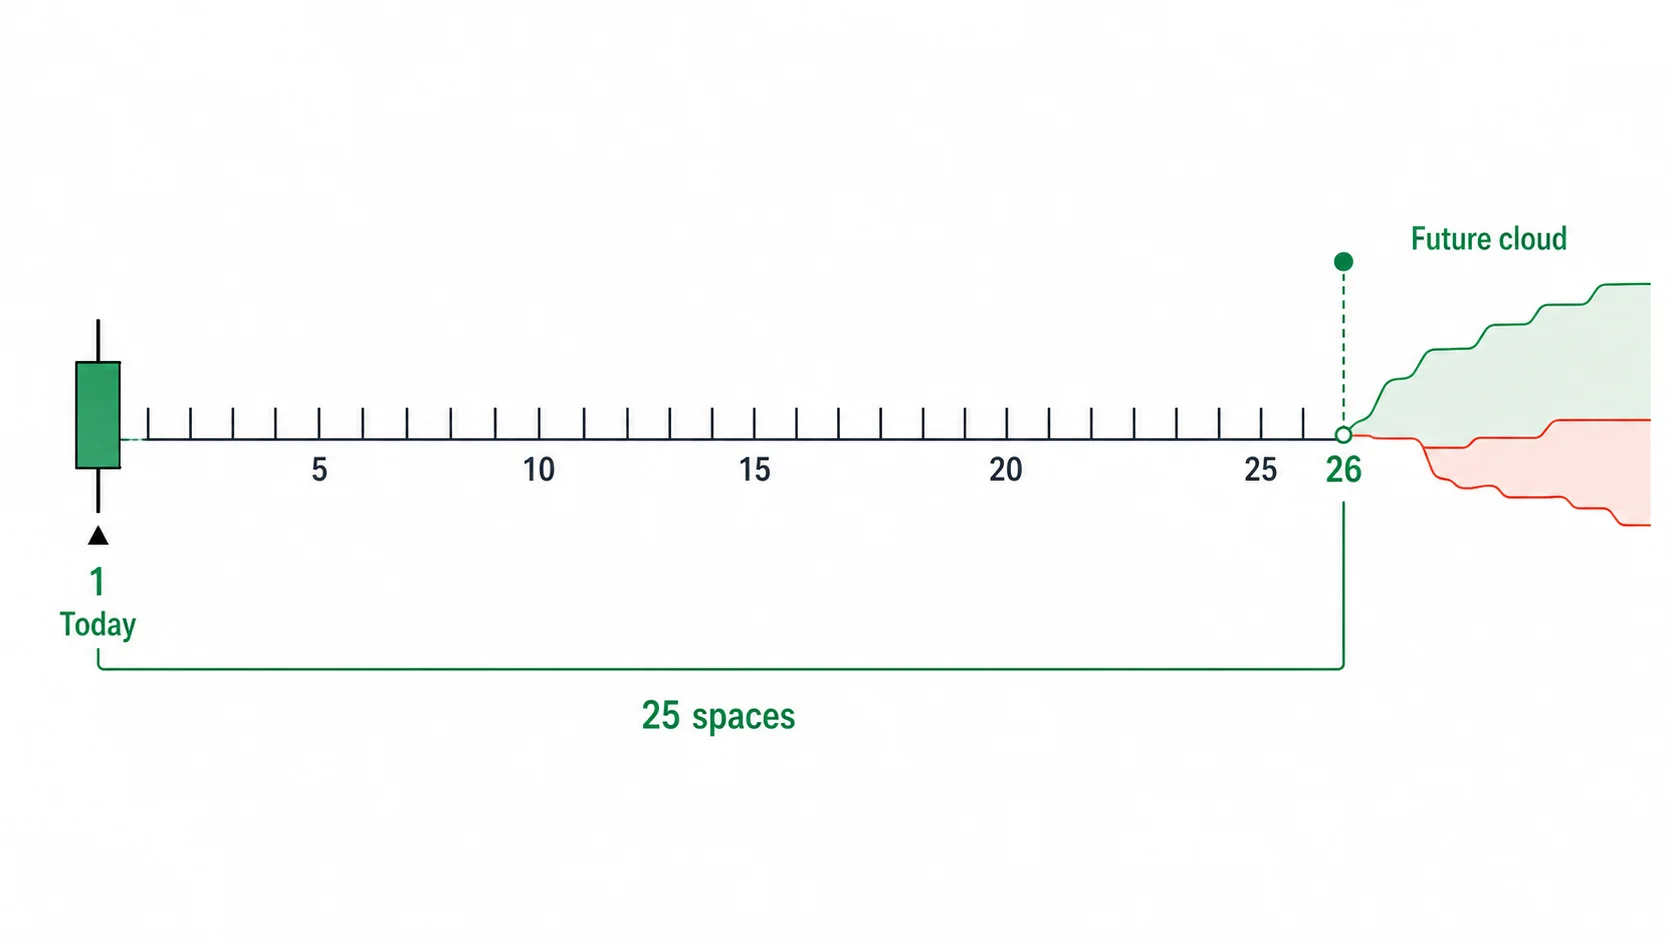
We say the cloud is shifted 26 bars ahead, but if you count the slots on the chart it often lands 25 slots ahead. Counting today's bar as 1, the 26th bar ends up 25 slots away from today. TradingView and many other platforms draw the cloud 25 slots ahead and the Lagging Span (Chikou) 25 slots behind.
This is not a platform error. It simply comes down to whether today is included in the count, and 26 and 25 point to the same span. Even if charts differ by one slot, treat them as pointing to the same location.
The future cloud is also drawn from past values
The cloud drawn into the future can look as if the market is forecasting what comes next, but it is not. The future cloud is calculated entirely from past and present values. Leading Span A uses today's Conversion Line and Base Line; Leading Span B uses the highs and lows of the most recent 52 bars. Those values, shifted forward as they stand, form the future cloud.
Goichi Hosoda shifted both lines forward on purpose, so that the balance built up to now is laid out in advance as future support and resistance. It maps where price will run into a level before it arrives there.
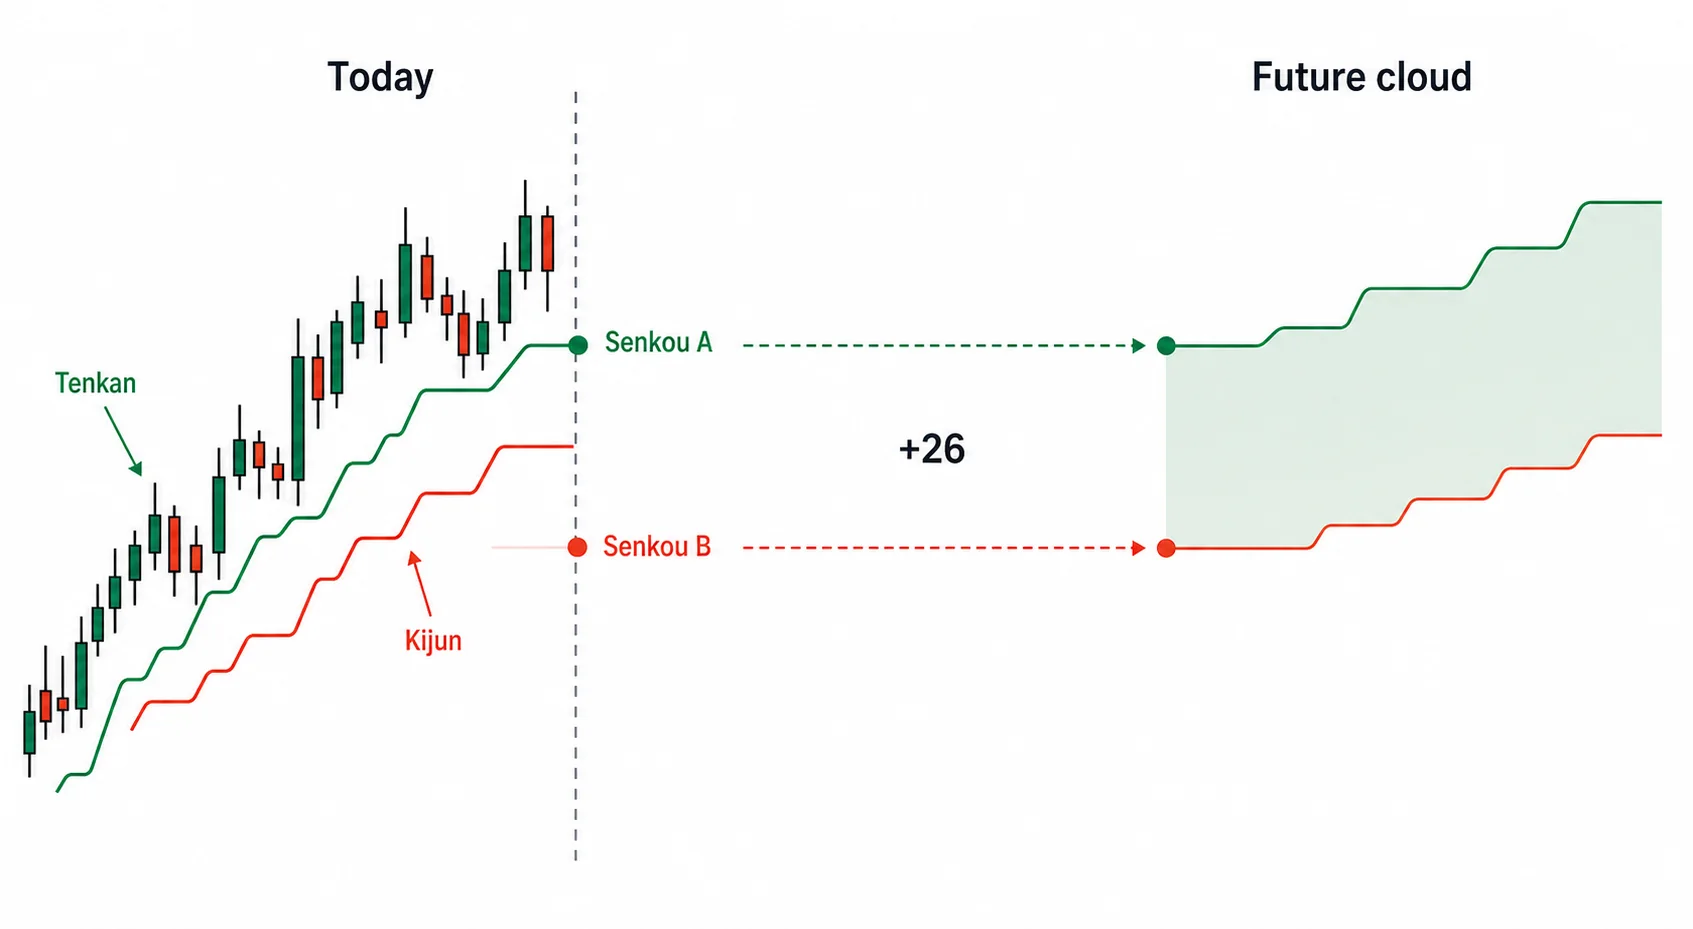
The future cloud therefore does not tell you where price will go. It draws in advance where the balance band sits when price arrives at that level. Miss this distinction and you will mistake the cloud for a signal that points to the future.
The 26 bars of future cloud drawn today stay in place until a new bar forms. Once a bar passes, one more slot of cloud is added at the far right, and the part already drawn does not change. So the near-term cloud just ahead is already fixed, and it barely moves until price reaches that level.
The slow boundary, Leading Span B, flattens into a horizontal line whenever the most recent 52-bar high and low go unchanged for a while. When that flat stretch is laid out ahead, it amounts to a fixed support or resistance price already drawn before price arrives. The flat boundary of the future cloud is therefore a level worth marking in advance.
Seeing it before price arrives
Because the cloud is drawn ahead, you can read the levels you will meet before price gets there. A thick cloud laid out above shows in advance a level where price is likely to stall, while a stretch where the cloud runs thin marks a level price should clear relatively easily.
In the future cloud you can also see in advance where Leading Span A and Leading Span B cross. When the two lines cross, the cloud flips top to bottom and the band changes color. You can tell where on the chart ahead that point lies before price reaches it.
What a change in the cloud's thickness or color means is covered in Part 4. The point here is that you can see those levels before price arrives.