OptiNod Academy
Ichimoku — Cloud Thickness and Twists
The cloud is not a buy or sell signal but support and resistance read by thickness. A thick cloud is a wall hard to cross, a thin one breaks easily, and the color-flip twist marks where the trend turns.
Cloud thickness is the gap between the two leading spans
As Part 1 showed, the cloud is the band that fills the space between Leading Span A and Leading Span B. Leading Span A is the Conversion Line (Tenkan-sen) plus the Base Line (Kijun-sen) divided by two, a line that averages the short-term center and the mid-term center one more time. Leading Span B is the midpoint of the highest high and lowest low over the last 52 bars, the slowest long-term center of the five lines.
The thickness of the cloud is the gap between these two lines. When Leading Span A sits well above Leading Span B, the cloud is thick; when the two lines hug each other, it is thin. Leading Span A is a fast balance built from 9 bars and 26 bars, and Leading Span B is a slow balance built from 52 bars. The gap between the two lines shows directly how far the short-term and mid-term balance sits from the long-term balance.
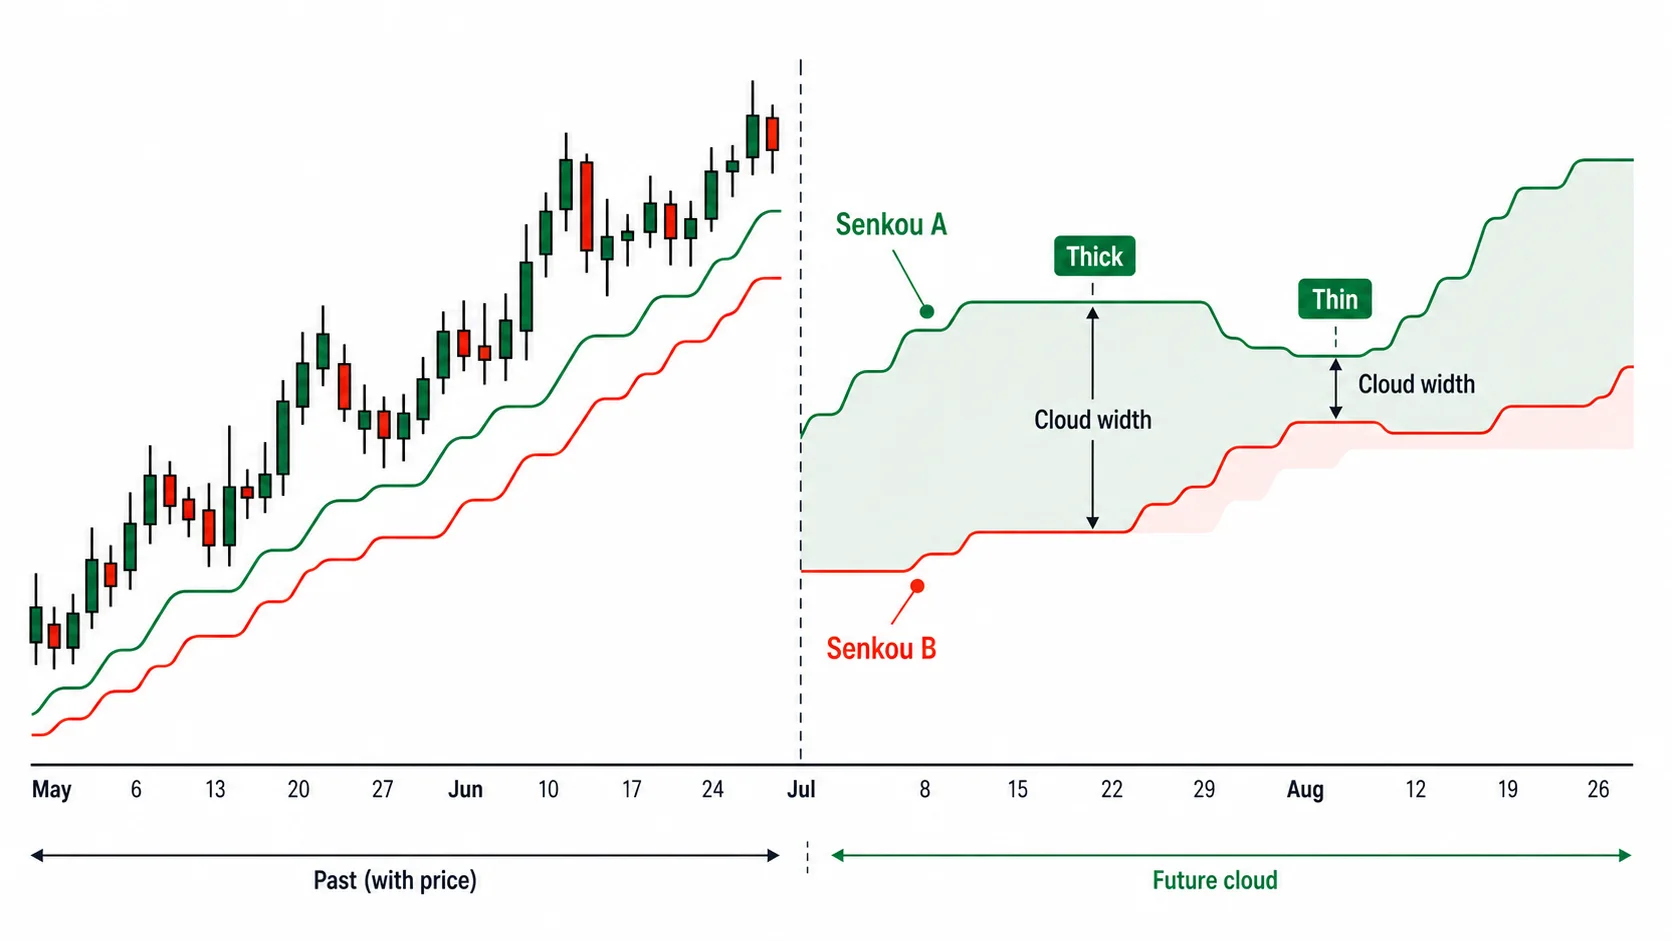
A wide gap between the two lines means the fast balance and the slow balance sit at very different levels. The cloud thickens in stretches where price has been driven quickly to one side, so the short-term center has run far ahead while the long-term center has not yet caught up. When the two balances draw close again, the cloud thins.
A thick cloud is a heavy wall
A thick cloud holds firm as support and resistance because the balance values of two timeframes both lie inside that stretch. For price to push up through a thick cloud, it has to clear in turn the long-term center captured by Leading Span B and the short-term center captured by Leading Span A. Balance values are packed densely between them, so price cannot break through in a single push and stalls once it is inside.
When price enters a thick cloud, both the upper and lower lines are far away, so it often gets trapped and ranges for a while. To exit upward it has to reach the top of the cloud, and to drop out it has to reach the bottom, and both are far off. That makes a thick cloud a spot where price is likely to stall as it approaches, and where it gets trapped and ranges once inside.
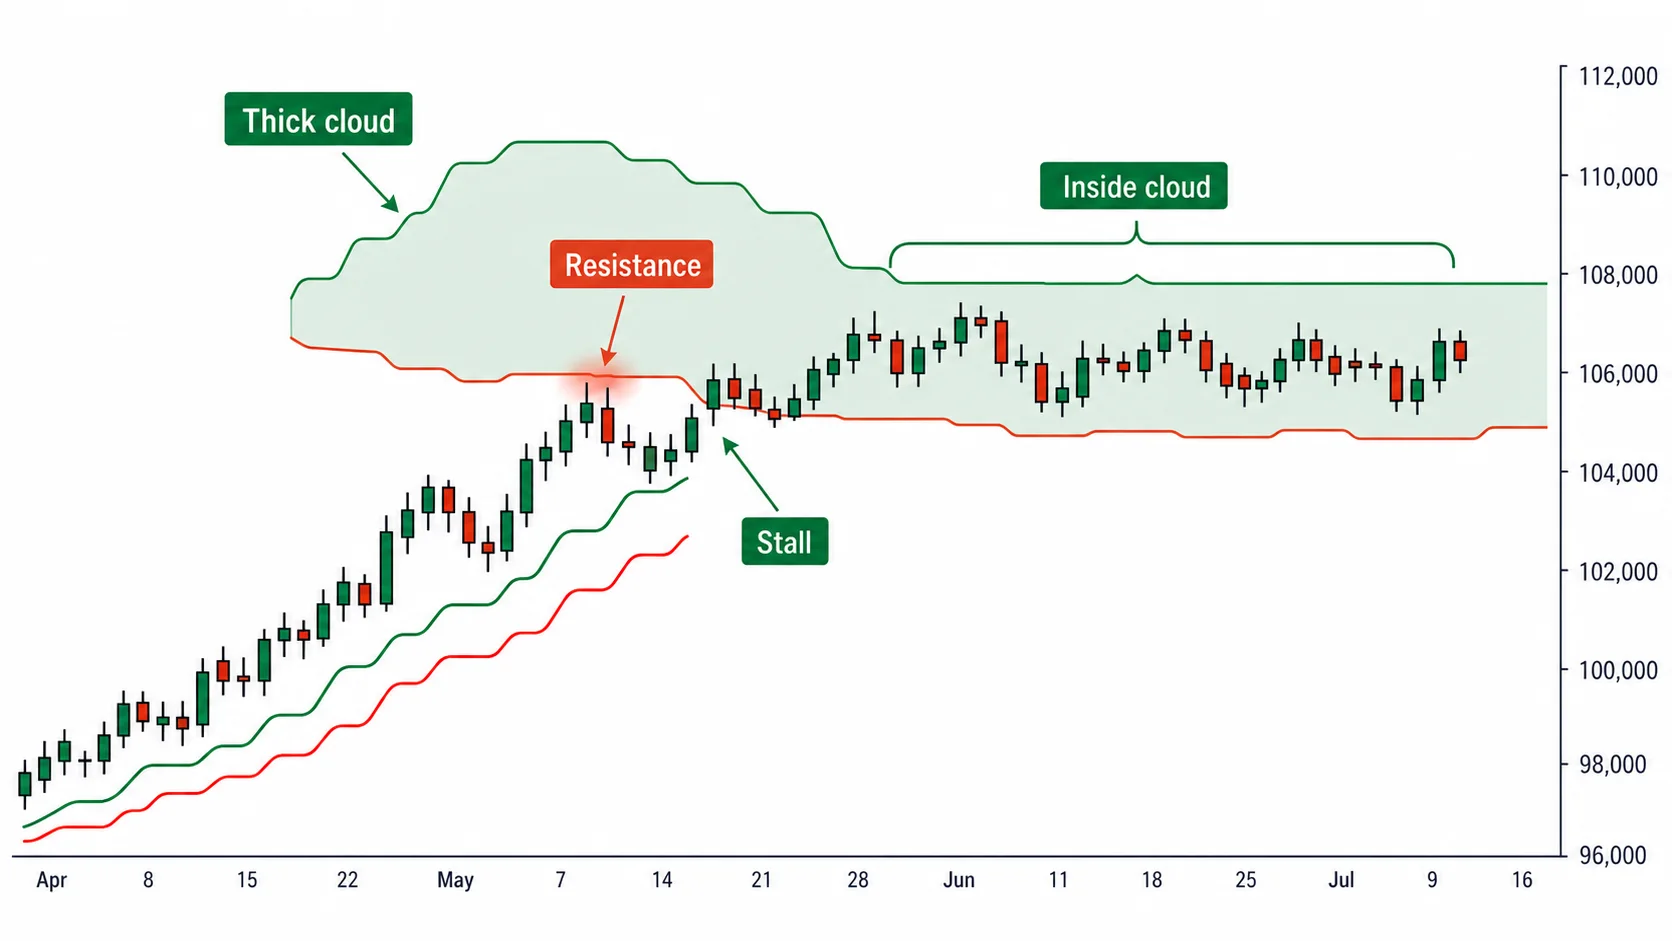
When a thick cloud floats overhead, price rising from below is first blocked at the lower line of the cloud. The thicker the cloud, the farther the upper line, and the more force and time it takes to break through. When a thick cloud lies below, it supports descending price in the same way.
Thickness is the number of bars needed to pass
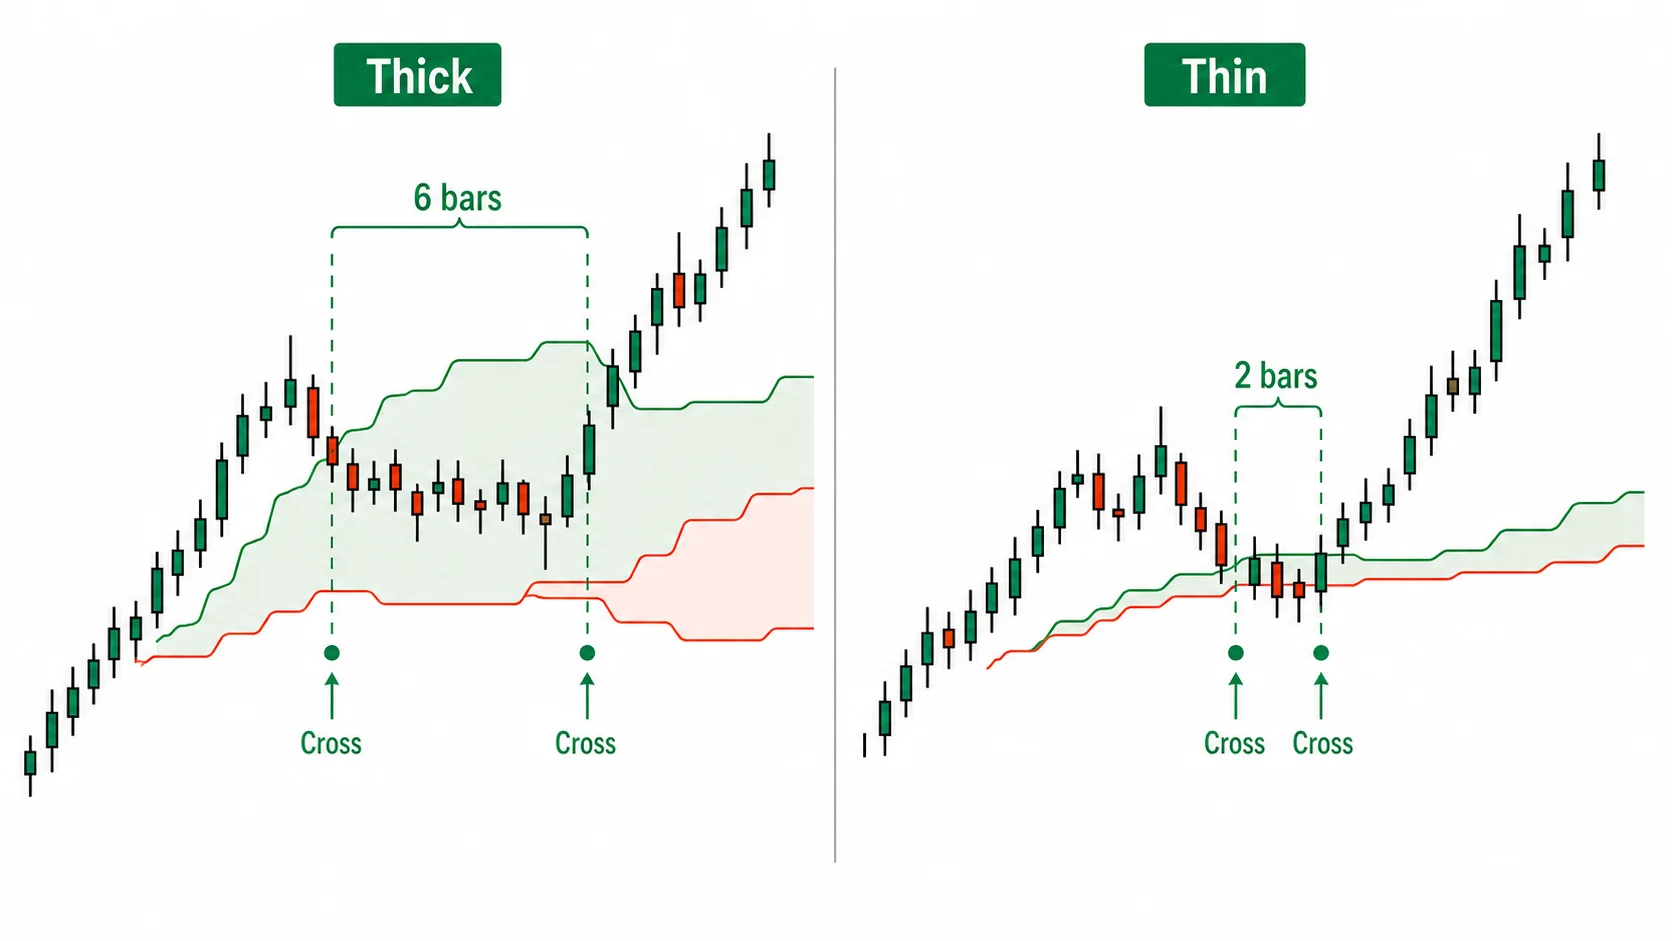
The word "thick" carries time with it. For the two leading spans to spread wide apart, price has to be driven to one side for many bars on end, and narrowing that spread back to pass through it takes just as many bars again. A thick cloud is a wall that demands more bars, that is, more time, for price to cross.
A thin cloud has the two balances gathered into a narrow span, so price crosses it in a handful of bars. Even with the same cloud, reading the thickness in terms of bars lets you gauge in advance how many days price will be held up when it reaches that stretch. Thickness is the height of the wall measured in price, and at the same time the number of bars it takes price to clear that wall.
A thin cloud is a gap that breaks easily
A thin cloud is a stretch where Leading Span A and Leading Span B hug close together, with the two timeframes' balances gathered into almost a single level. When price passes through, the balance values it has to clear are crowded into a narrow span, so it does not stall inside the way it does in a thick cloud but breaks out in one move.
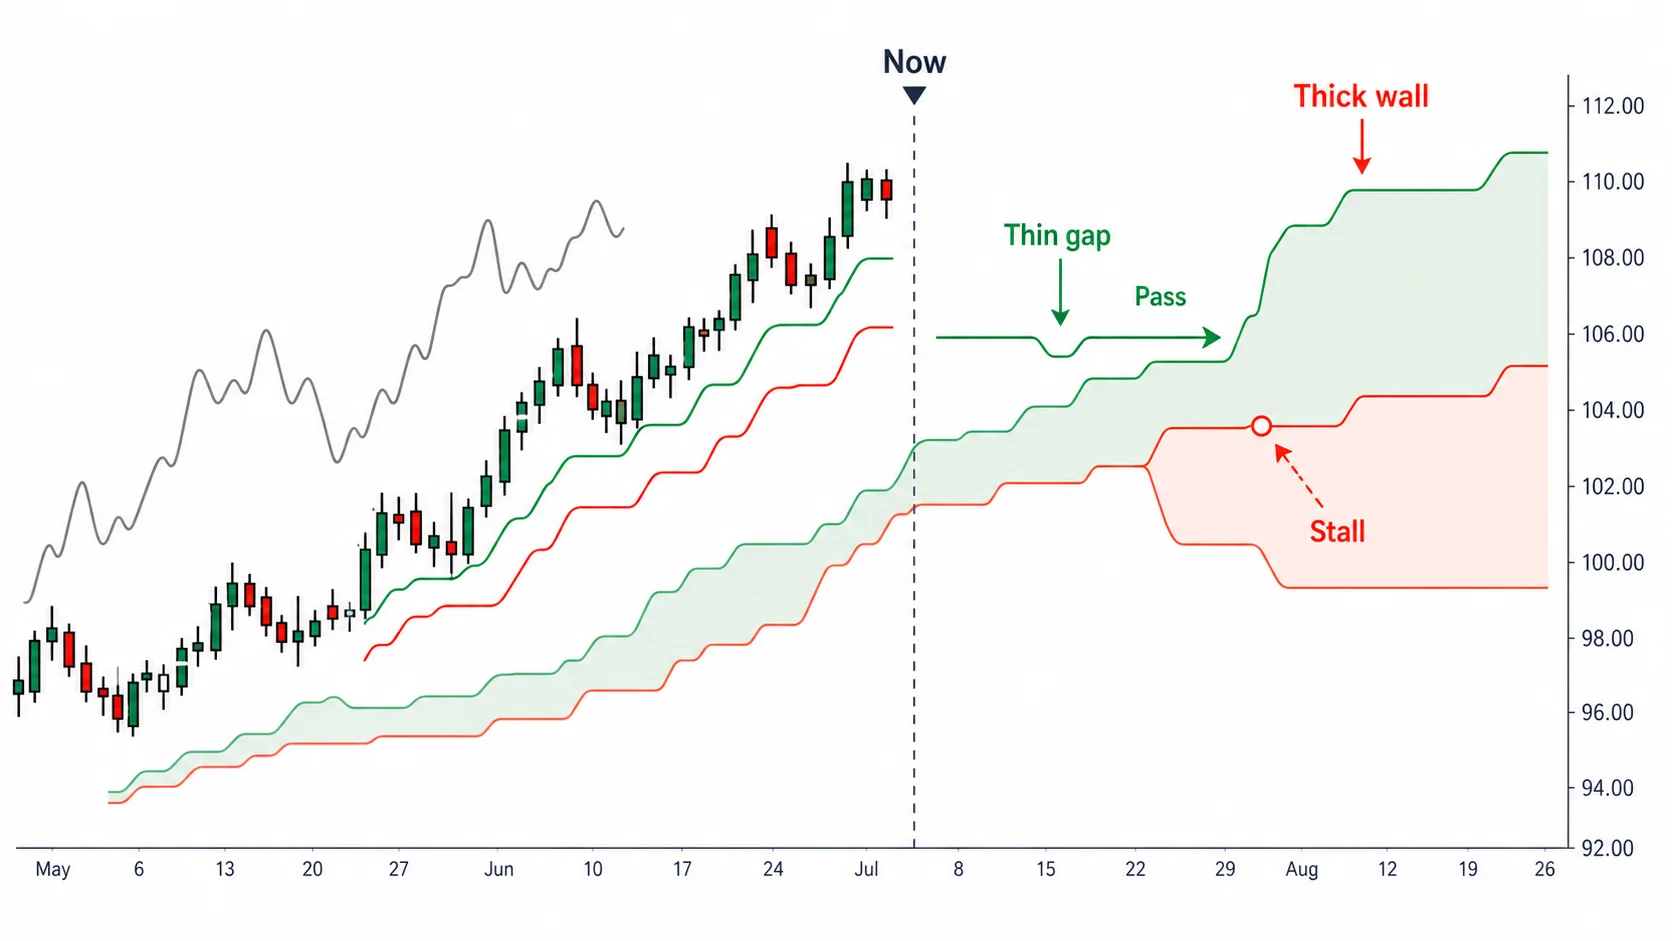
For that reason, a thin-cloud stretch reads as a spot where a breakout comes easily. Using the Part 2 property that the cloud is drawn ahead into the future, you can read on today's screen where thin cloud lies up ahead. By the time price reaches that thin stretch, it is likely to pass through with little resistance.
The cloud drawn into the future is a projection of already-confirmed past values shifted 26 bars forward. As Part 2 showed, it maps where support and resistance terrain will lie ahead. A thin cloud visible up ahead is terrain information telling you the wall at that spot is shallow; whether price actually reaches it is a separate matter.
English-language use looks only at above or below and misses the thickness
In the English-language world the cloud is read only by whether price is above or below it, never by its thickness. The mere fact that price has climbed above the cloud counts as a breakout. Under this usage, a weak breakout that lightly crossed a thin cloud and a firm breakout that drove hard through a thick cloud get bundled into the same signal.
Crossing a thin cloud means the wall to cross was shallow to begin with, so on its own it does not count as a firm breakout. Reading by thickness makes the reliability of an entry spot clear. A breakout that drove hard up through a thick cloud reads as a firm spot that beat heavy resistance. A spot that lightly cleared a thin cloud is not trusted on its own, and counts as a setup only when a Lagging Span (Chikou) bullish turn from Part 3 and a price breakout of the cloud line up together.
Gauge thickness with ATR
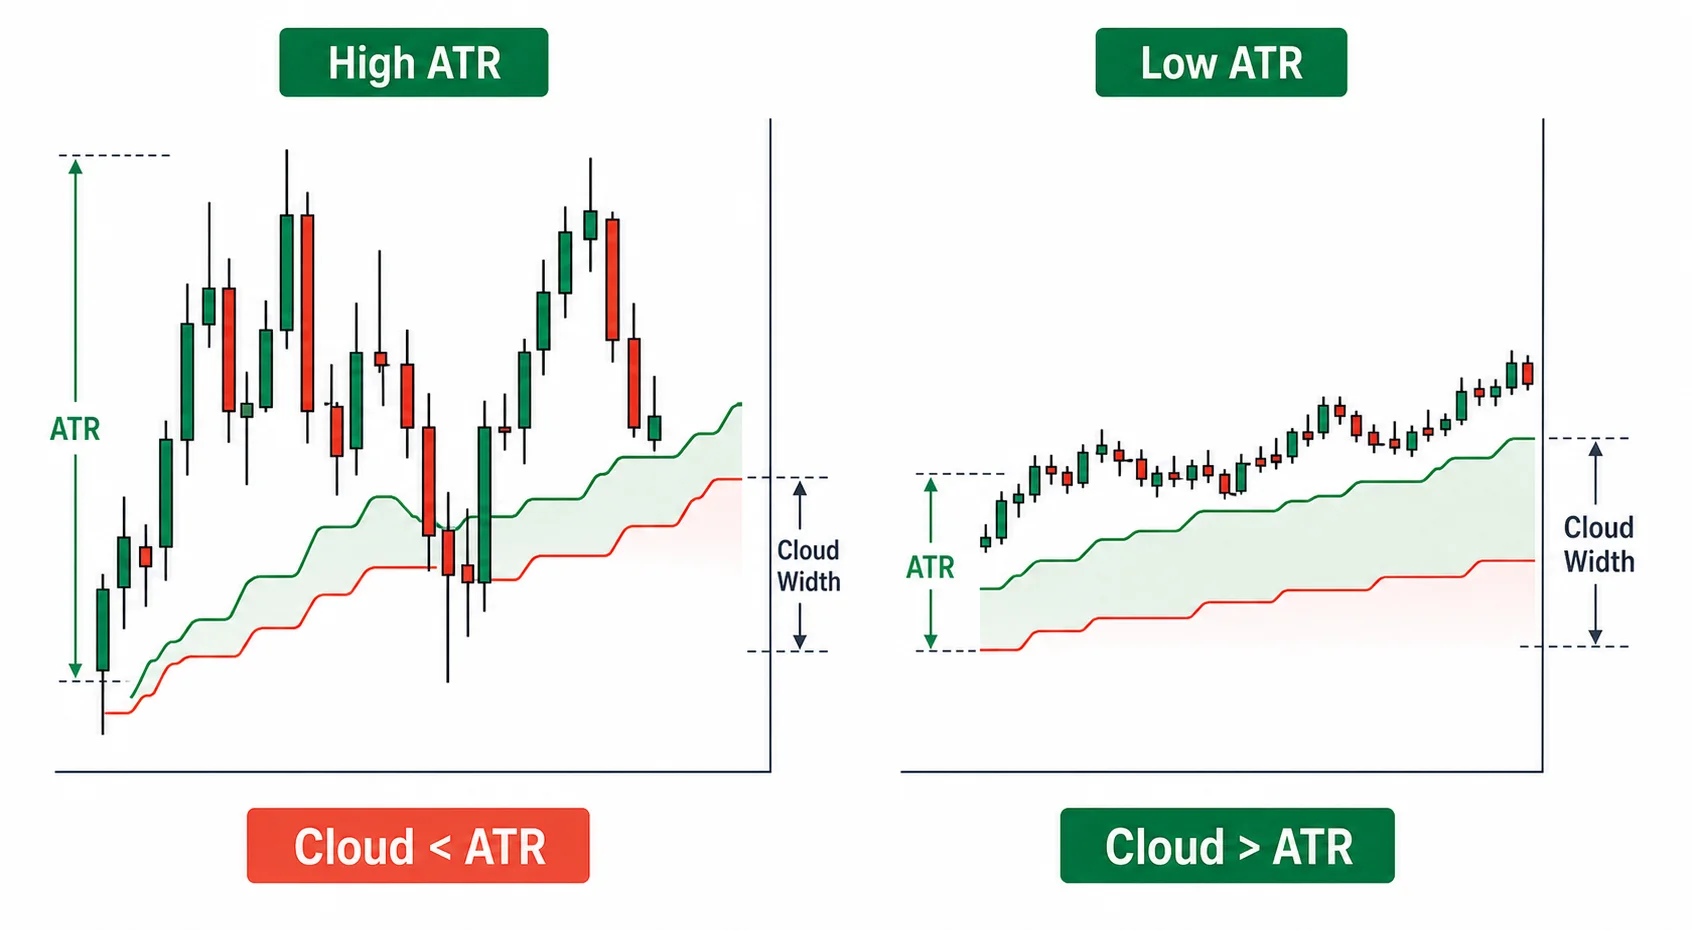
There is no absolute standard for judging whether a cloud is thick or thin. The same span runs thin for a high-volatility instrument and thick for a calm one. An instrument that moves a lot in a day passes through any ordinary cloud in half a day, while in a calm instrument the same span becomes a wall that holds for days.
So thickness is gauged against that instrument's volatility. ATR measures how much one bar typically moves, so looking at how many times ATR the cloud thickness comes to lets you measure across different instruments by the same yardstick. Roughly, when cloud thickness runs past three or four times ATR it is a thick wall that price needs several bars to cross, and when it falls short of one times ATR it reads as a thin gap that price passes in a single bar. These multiples are not a fixed standard value. They are a rough guideline tuned to the instrument and timeframe.
Link thickness to stop width and size
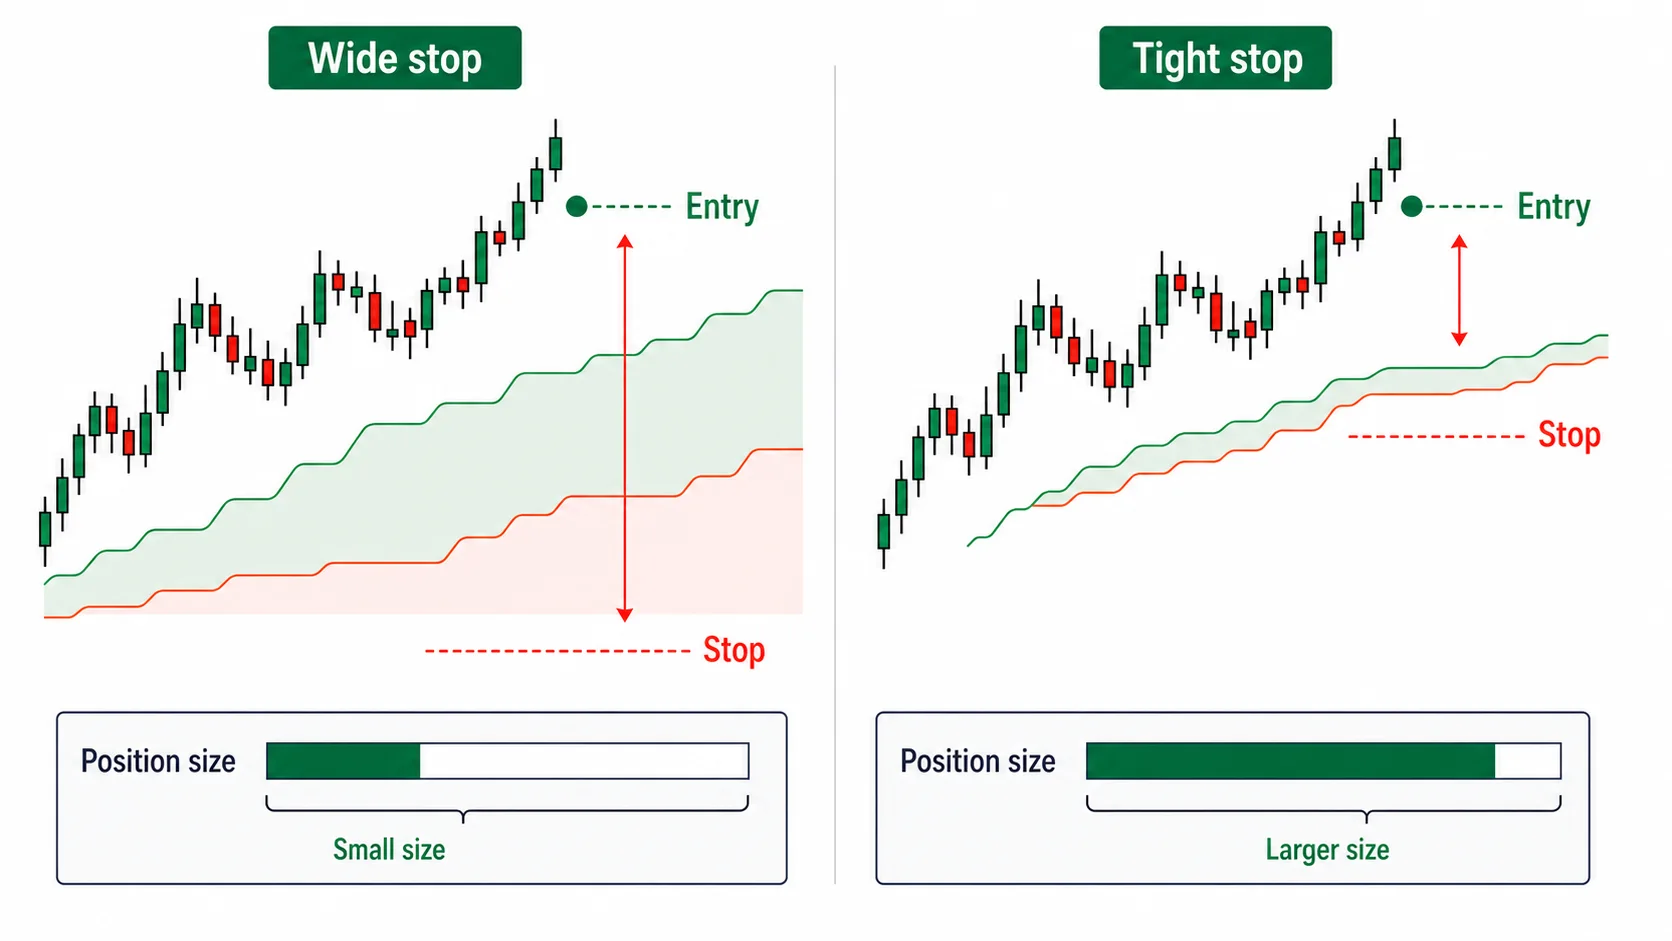
Thickness measured by ATR feeds directly into the entry decision, the stop width, and the size decision. When a wall thicker than three or four times ATR stands overhead, do not chase a breakout in front of it. Price is likely to range for a long time inside after touching the lower line of the cloud, and chasing in gets you caught in that range.
Set the stop width to match the thickness. When you enter with a thick cloud in between, price has room to swing to the opposite line of the cloud, so the stop has to be set as wide as the cloud thickness to avoid being swept out. As the stop widens, cut the size you put on at once so the loss amount stays at the same level. In front of a thin cloud the stop can be set narrow, so the same loss amount can carry a larger size.
The color-flip twist is where the phase changes
The spot where Leading Span A and Leading Span B cross each other is the twist of the cloud. When Leading Span A is above Leading Span B, the cloud is usually painted one color, and when it drops below and the two lines flip, it is painted another. The twist is the point where the up-down order of the fast balance and the slow balance reverses. At that spot the cloud changes color and the phase of the trend turns over.
At the twist the two leading spans meet, so cloud thickness approaches 0. That point, where it is thinnest, is also where price passes most easily. Near the twist the cloud is at its weakest as support and resistance.
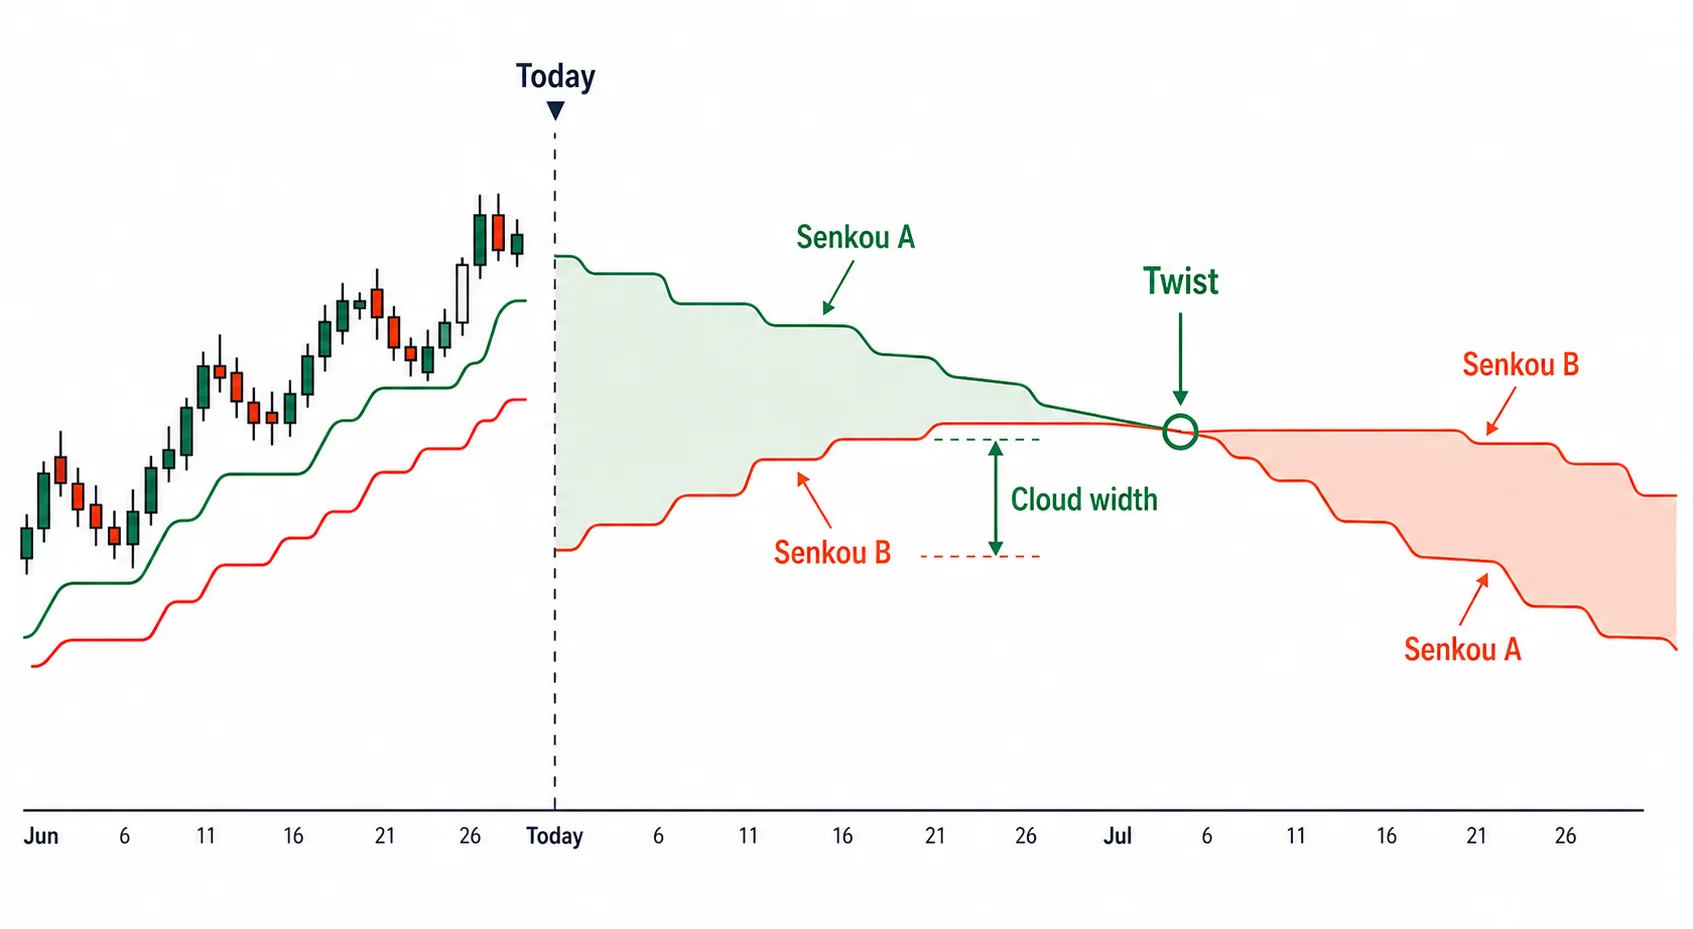
The twist matters because it meshes with the drawn-ahead property from Part 2. The cloud is drawn 26 bars ahead, so a twist that lies up ahead is visible now on the screen. It marks in advance, on the calendar, roughly where in the future a candidate point for a phase change sits. When a thick cloud up ahead is seen thinning gradually and then twisting, watch that point as a spot where the trend may turn.
The twist is not an entry signal in itself. A color change is not a spot to buy or sell on the spot. It is a signal for gauging how long to carry a held position and for watching in advance the timeframe in which a turn in the trend is imminent. Take an entry when the Lagging Span (Chikou) confirmation from Part 3 and a price breakout of the cloud line up together.
A downward trend is read in reverse
So far we have looked with the upward trend as the reference. In a descending trend the same reading is flipped from up to down. When a thick cloud lies below, it is a heavy floor supporting descending price, so do not chase the decline in front of that wall. Price can range for a long time inside after touching the upper line of the cloud, so a chased short gets caught in that range.
When only a thin cloud lies below, the floor that would support price is shallow, so price breaks down easily. Reading the thin stretch on the future side in advance lets you gauge where the decline will speed up. The spot where Leading Span A drops below Leading Span B and the cloud twists into a bearish color is a candidate point for a turn into a bearish phase. Take an entry where the pieces line up together: the Lagging Span (Chikou) drops below the price level of 26 bars ago and price settles below the cloud.