OptiNod Academy
Ichimoku — Reading I, V, and N Waves
Read trend through three wave shapes, I, V, and N; don't call it reversed until the N-wave fails to complete and the third leg clears the prior extreme.
Read trend through three wave shapes: I, V, and N. Don't judge it by which line price sits above alone. To call a trend finished, an N-wave must complete and its third leg must clear the immediately prior extreme; so during the retracement (V) stage, keep your bias on the move continuing.
The theory that reads the shape of price
Ichimoku Kinko Hyo rests on three pillars. Time theory watches when time changes, wave theory watches what shape price moves in, and price-target theory (Nehaba Kansoku) measures how far that shape will run. Goichi Hosoda called these the three pillars, and the five lines are the tools that carry these three theories onto the chart.
Wave theory is the one that reads the shape of price. It breaks the rise and fall of price into a few simple shapes and asks how far the current move has come. There are only three shapes: the I-wave, which runs in a single direction; the V-wave, which runs and then retraces; and the N-wave, which runs, retraces, then pushes again. Even a chart that looks complex is, in the end, these three shapes strung together.
The I-wave, the V-wave, and the N-wave
The three waves are distinguished by the number of legs. A leg is a single segment where price runs in one direction without a break.
I-wave. The simplest shape, complete in a single leg. Price climbs straight in one direction from a low to a high, or falls straight from a high to a low, with no meaningful retracement in between. An I-wave alone can't tell you whether the move will continue or stop here.
V-wave. An I-wave with a retracement attached, giving it two legs. Price rises and then pulls back, or falls and then bounces. The first leg is the thrust, the second leg is the retracement. With only the V-wave in view, you can't yet confirm whether this retracement is a brief pause or the point where the trend has reversed.
N-wave. A V-wave with one more thrust attached, making three legs. Price rises, pulls back, and rises again; or falls, bounces, and falls again. The first leg sets the direction, the second leg retraces, and the third leg pushes the same direction again. All three legs together make an N-wave.
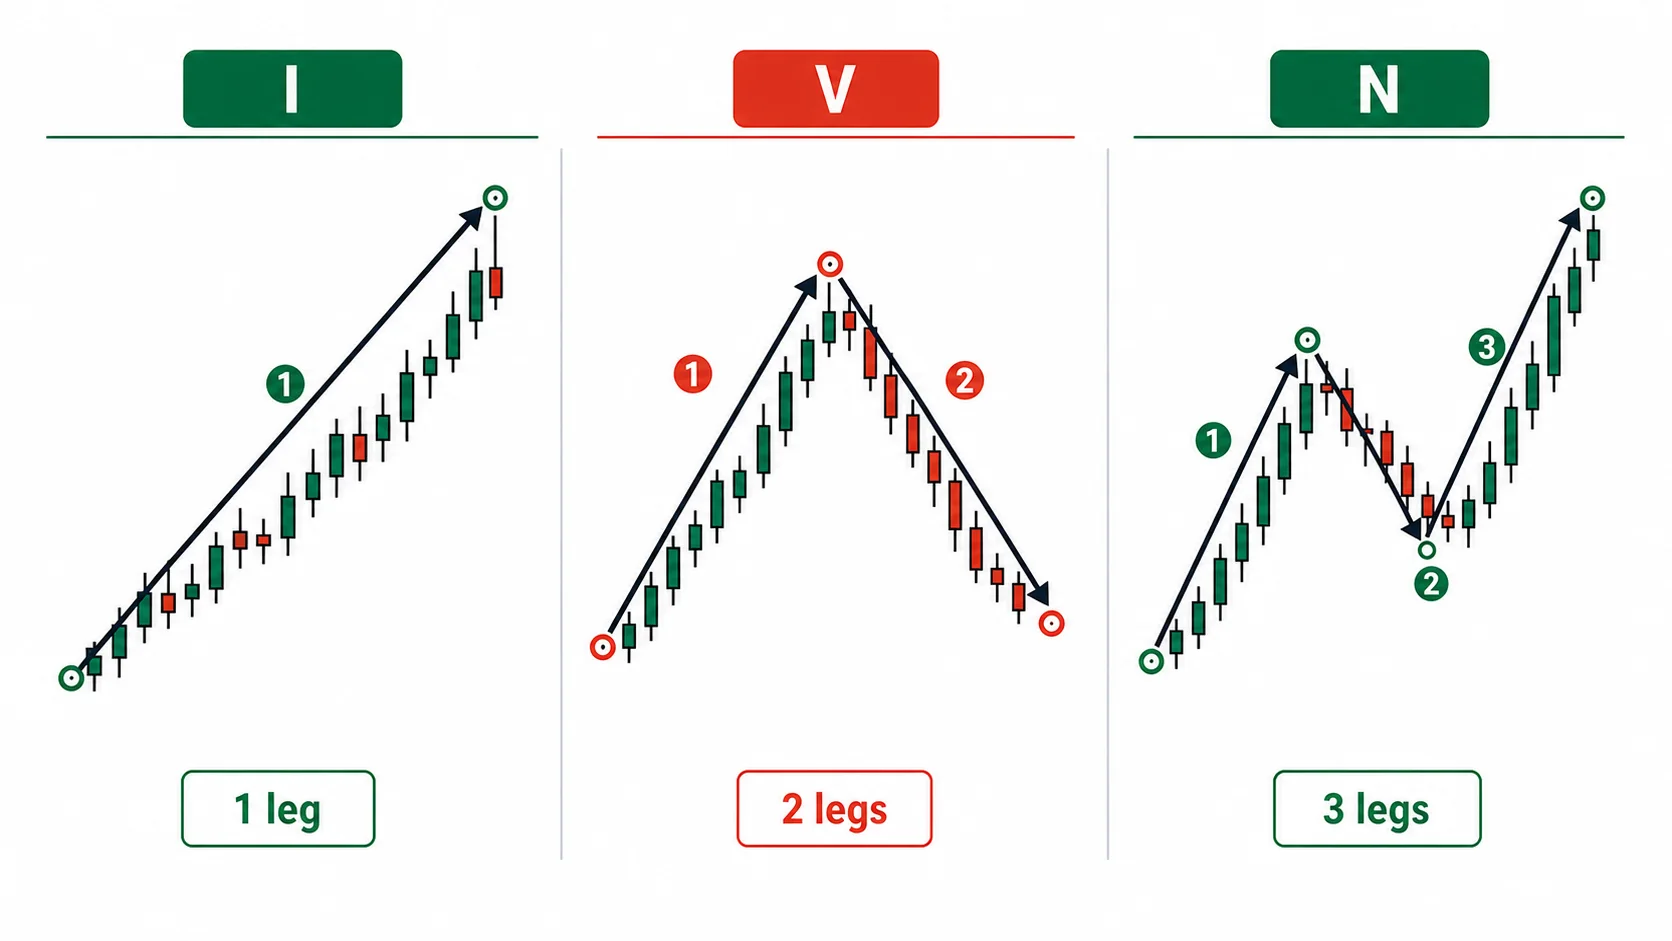
The shape follows the letter itself. I is a single straight stroke, V is two strokes that go out and come back, N is three strokes that go up, come down, and go up again. The rising N and the falling N are the same shape with only the direction flipped.
Why the N-wave is the base unit
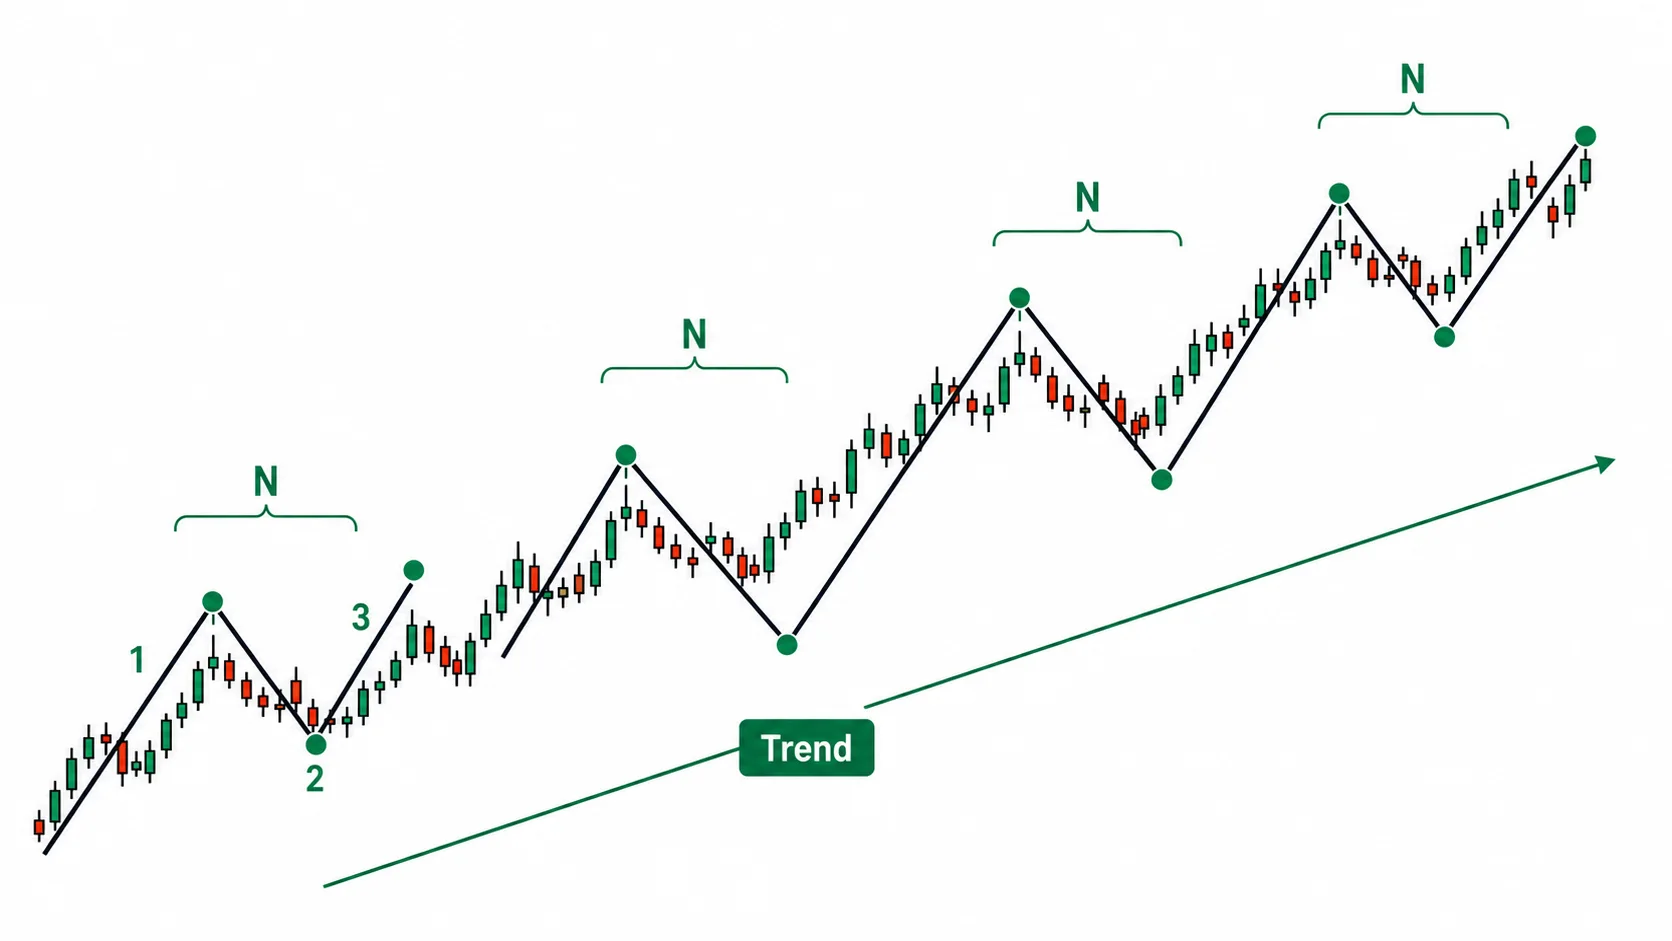
Of the three waves, the one Ichimoku takes as its base is the N-wave, because every trend is made of a succession of N-waves.
Picture an uptrend: price doesn't climb straight up in one go. It rises, pulls back, and rises again. That single bundle is an N-wave. Rise, pull back, and rise above the prior high, and another N-wave stacks on top. A long-running trend is simply N-waves attaching one after another in the same direction.
The I-wave and V-wave are intermediate stages on the way to an N-wave. With only the first leg out, you have an I-wave; once the retracement is out, a V-wave; and only when the re-thrust is out is the N-wave complete. The N-wave is the shape that finishes as a single complete form, which is why it serves as the reference unit when you count waves.
The misconception that it is the Japanese Elliott
Wave theory is often dismissed as a Japanese copy of Elliott Wave. The two do look similar in that both see price as a chain of waves, but they start from different premises.
Elliott Wave assumes a fixed count of five impulse waves and three corrective waves, and places each wave within a fractal structure that subdivides into lower waves following the same rule. Wave theory has no such fixed count. Its base unit is the three-leg N-wave, and a trend is seen as these N-waves repeatedly attaching in the same direction. It doesn't enforce a numerical 5+3 rule; it judges simply by whether a leg has cleared the immediately prior extreme. Where it agrees with Elliott Wave and where it differs is laid out separately in Part 8.
The single condition for an N-wave to complete
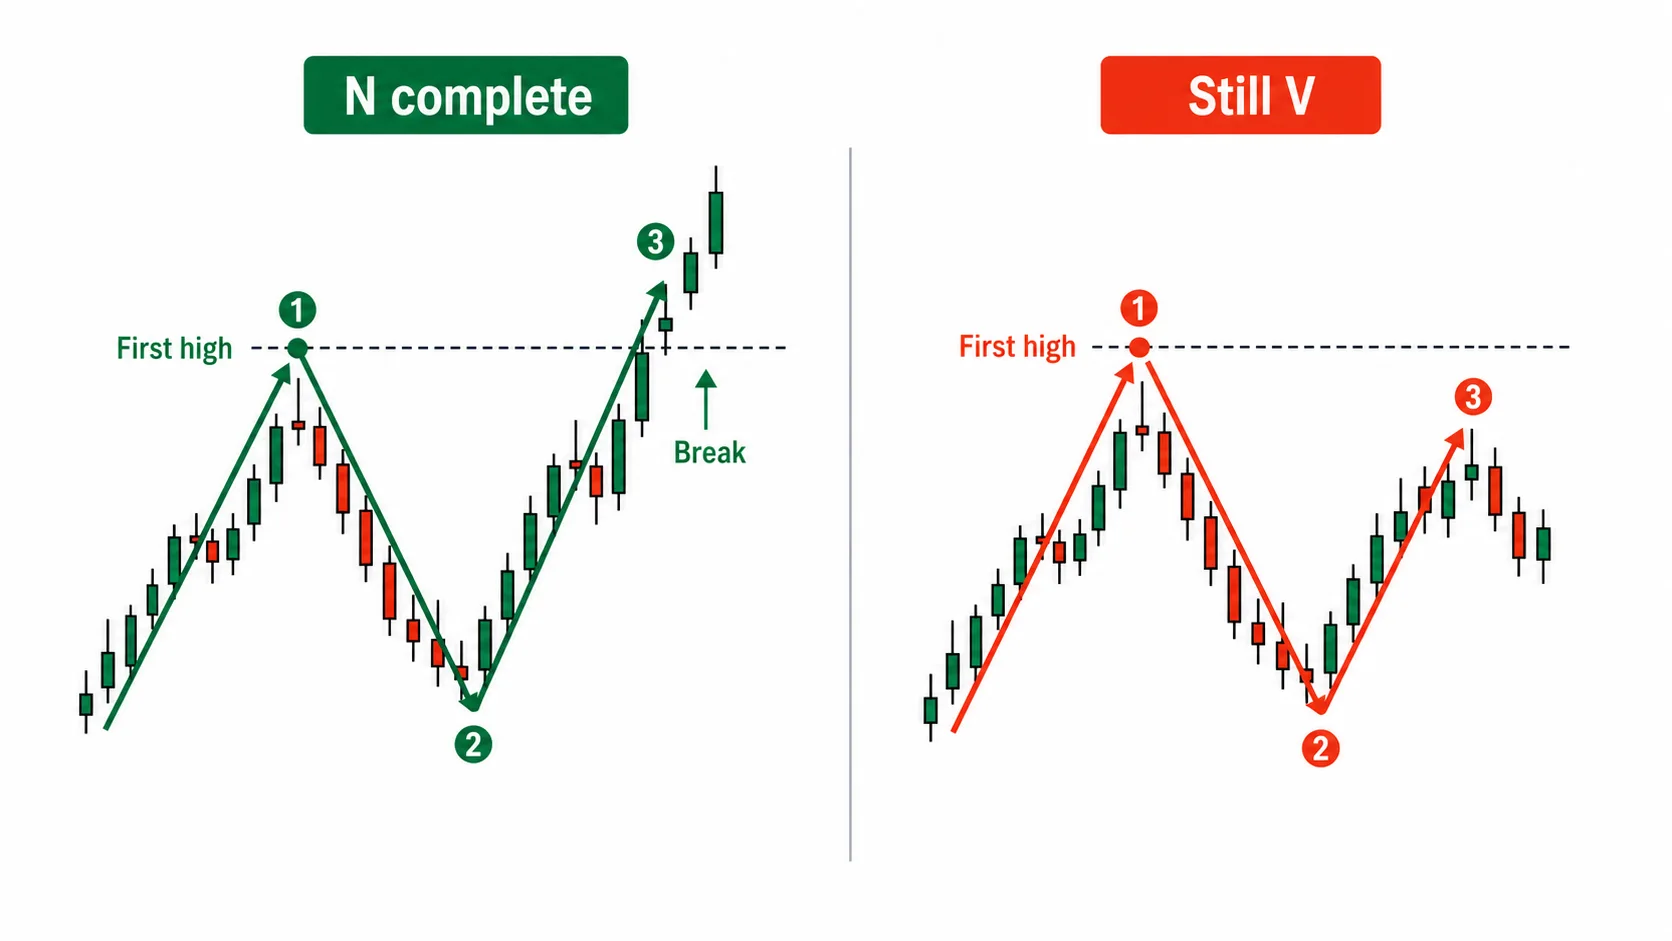
The V-wave and the N-wave are divided by one criterion: the third leg must clear the immediately prior extreme (on a rise, the high made by the first leg; on a fall, the low made by the first leg) for the N-wave to complete.
On a rise, it works like this. The first leg climbs to some high, then the second leg pulls back. The third leg rises again, and when it clears the first leg's high on a closing basis, the N-wave completes. If it fails to clear that level and stalls below it, you don't yet have an N-wave; you read it as a V-wave stage in which the second leg's retracement hasn't finished.
This one line is the most important rule in wave theory. Whether the third leg clears the prior high is what settles whether the move has advanced one stage further. If it clears, another N-wave stacks in the same direction and the trend continues; if it fails, that point may be where the trend reverses.
Trend termination is judged only by N completion and breakout
From here comes the principle of live judgment. An uptrend isn't declared to have reversed until the N-wave fails to complete.
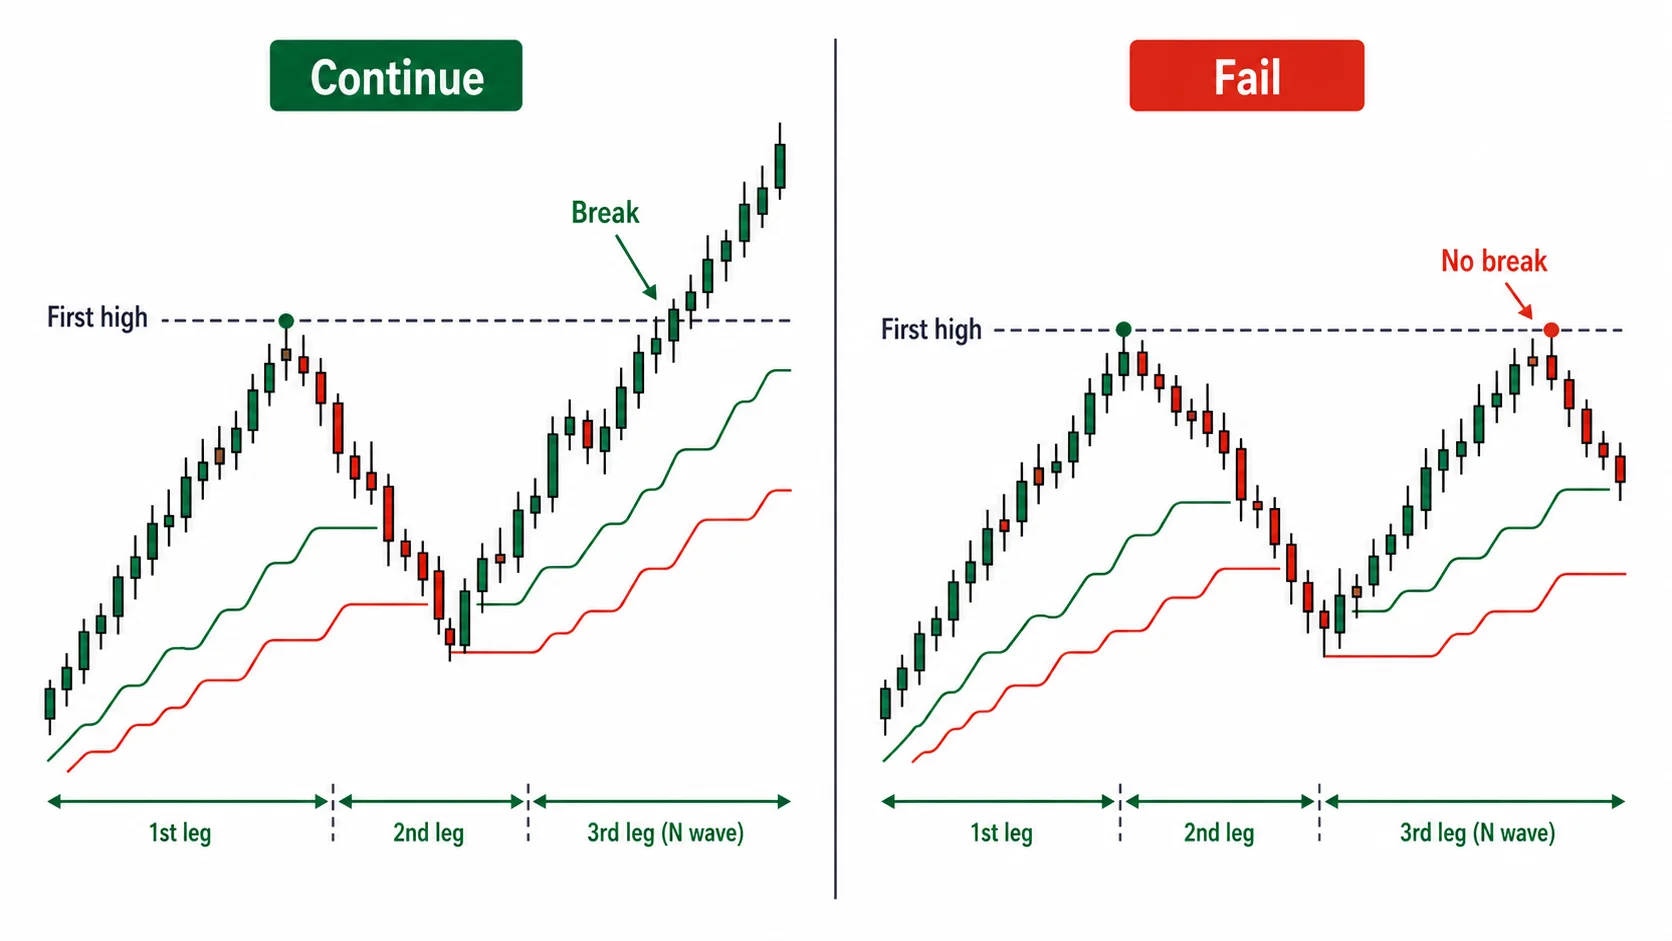
While price pulls back on the second leg, the move can easily look finished. But this retracement is a normal stage that builds the N-wave. At the V-wave retracement, keep your bias on the trend continuing and wait for the third leg to rise again and clear the first leg's high. If it clears, the trend has continued.
The point to doubt the trend is elsewhere: when the third leg does rise but fails to clear the first leg's high and stalls below it. It has failed to advance one stage further in the same direction, and only then do you treat the trend as liable to reverse. If you call the trend over in advance just because the retracement is deep, you mistake a normal second leg for the end and miss the third leg that follows.
Which leg are we on right now
To make this call in real time, you first have to pin down which leg price is on right now. If it's pushing in one direction for the first time, that's the first leg; if it's retracing after that, the second leg; if the retracement has finished and it's pushing the same direction again, the third leg. The moment the third leg clears the prior high, the N-wave completes, and the first leg of the next N-wave begins above it.
This counting has two common traps. The first is choosing the reference wave arbitrarily. On the same chart, the wave count changes depending on which low and high you take as the two ends of the first leg. Pick the endpoints to fit the picture you want to see, and the waves can be counted any number of ways. Mark meaningful highs and lows by a consistent criterion, and don't change that criterion partway through.
The second is hindsight bias. Spread the whole chart out and look back, and the N-waves stand out clearly; but at the right-hand edge, the live point, it isn't yet settled whether the current leg is a second-leg retracement or a reversed trend. Mistake a wave that became clear only in hindsight for one that was just as clear in real time, and in actual trading you'll treat an unsettled point as a settled one.
When an N-wave completes, price-target theory measures how far the next leg will run with four targets, N, V, E, and NT; these four values aren't prices guaranteed to be reached. They are candidate levels whose reliability rises when they coincide with a change day from time theory, and the formulas for the four targets are laid out separately in Part 9.