OptiNod Academy
Ichimoku — Nested N-Waves
Add to the position each time a small N-wave completes in the large N's third leg, trim on a retracement near the target, and read P and Y waves as a volatility filter.
A large N-wave contains smaller N-waves nested inside it. As the third leg of the large N-wave unfolds, you add to the position in pieces each time a small N-wave completes, and you trim when momentum breaks near the target on a small retracement leg. Contracting (P) and expanding (Y) waves act as a filter that tells you whether volatility is gathering or dispersing right now.
A large wave holds smaller waves inside it
Part 6 covered the three waves I, V, and N. One leg is an I-wave, two legs form a V-wave, three legs form an N-wave, and the N-wave is the basic unit for counting waves. Part 7 starts from the idea that a single N-wave can sit entirely inside one leg of a larger N-wave.
Suppose you have drawn one stretch of a large N-wave on the daily chart. The first leg rises from low A to high B, the second leg falls from B to the pullback low C, and the third leg rises again from C. Drop down to the 4-hour or 1-hour chart to view each of these large legs, and price does not travel in a single straight line within it. It carves out several small highs and lows, drawing small N-waves as it climbs.
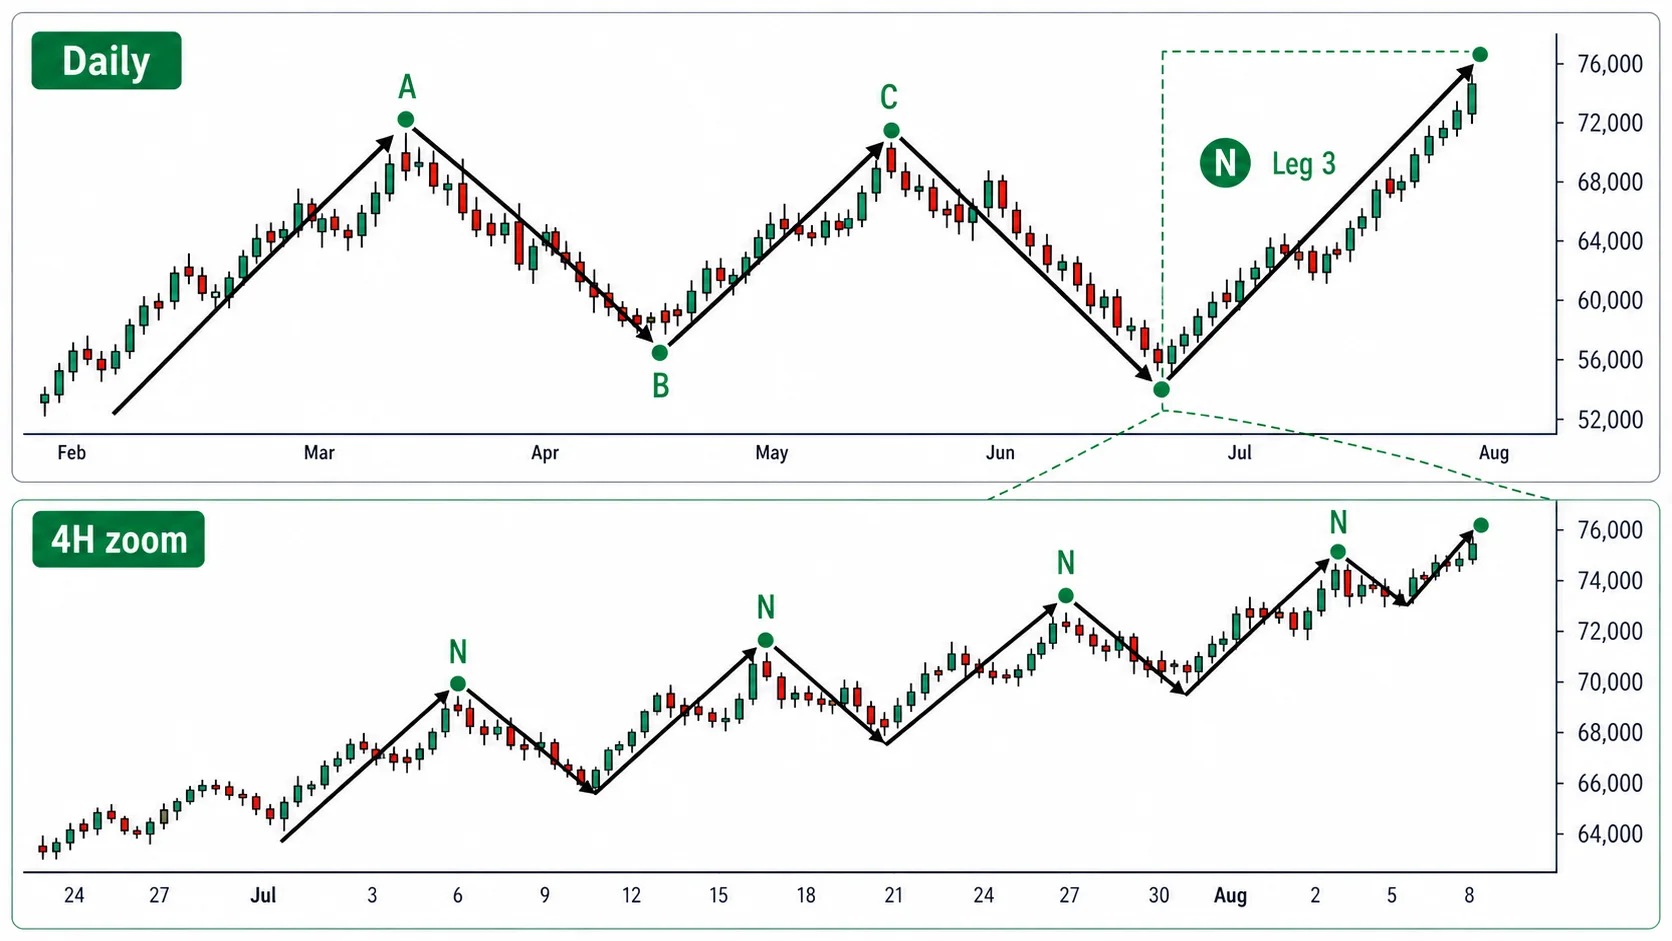
The fact that one leg on a higher timeframe breaks into several small legs on a lower timeframe is the heart of reading waves across timeframes. The large N-wave sets the direction and the target of the move, while the small N-waves inside it set where to enter and where to exit.
You scale in across the third leg of the large N-wave
In a large N-wave, the longest leg with the strongest thrust is the third leg. Because price has to leave C and clear B for the N-wave to complete, the third leg aims at breaking the prior high B, and the thrust concentrates in that direction. As Part 6 showed, an N-wave completes when its final leg exceeds the prior extreme, and the leg where that breakout occurs is the third leg. Scaling in takes place as this third leg unfolds.
The method is simple. Within the third leg of the large N-wave, you add to the position each time a small N-wave completes. When a small N exceeds its prior small high and completes, the large move has advanced by one more leg, so you add weight at that spot. When the next small N completes, you add again. Rather than putting on full size all at once, you build the position in stages, confirming the completion of each small N.
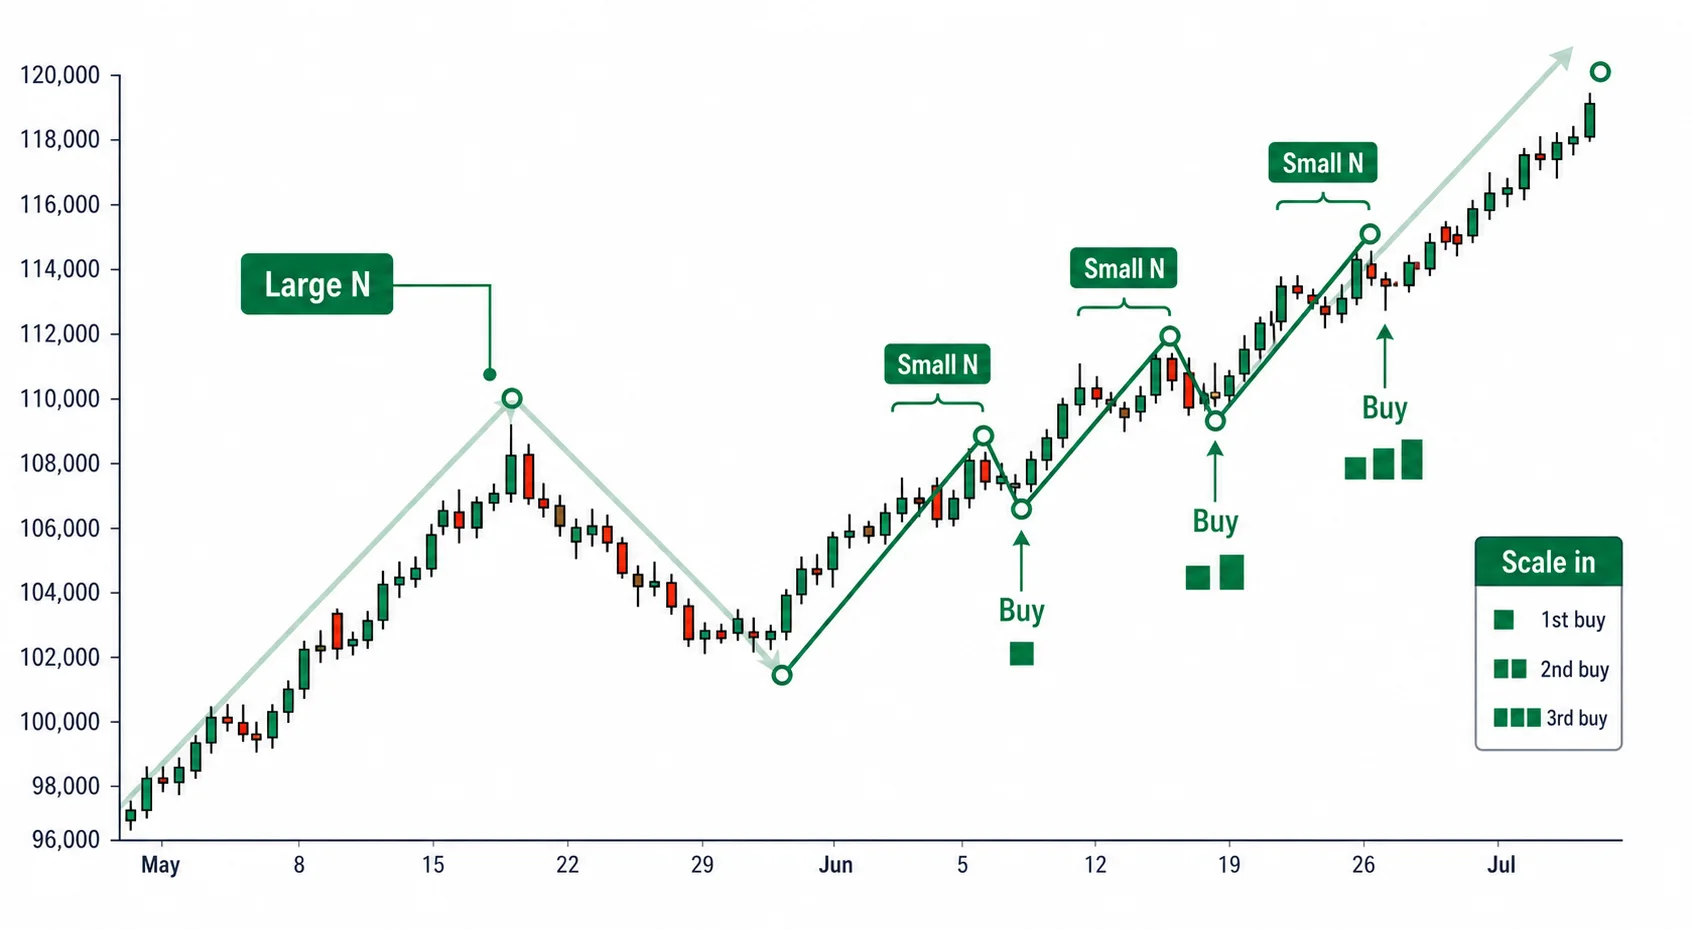
Scaling in this way lowers the risk of putting on the entire size in one spot and getting pulled back immediately. Since you add only when a small N completes, you wait through the small retracement leg rather than buy into it. As long as the large move continues, small N-waves keep completing and extending upward, and the position grows in step with the trend.
You narrow the entry by the depth of the pullback
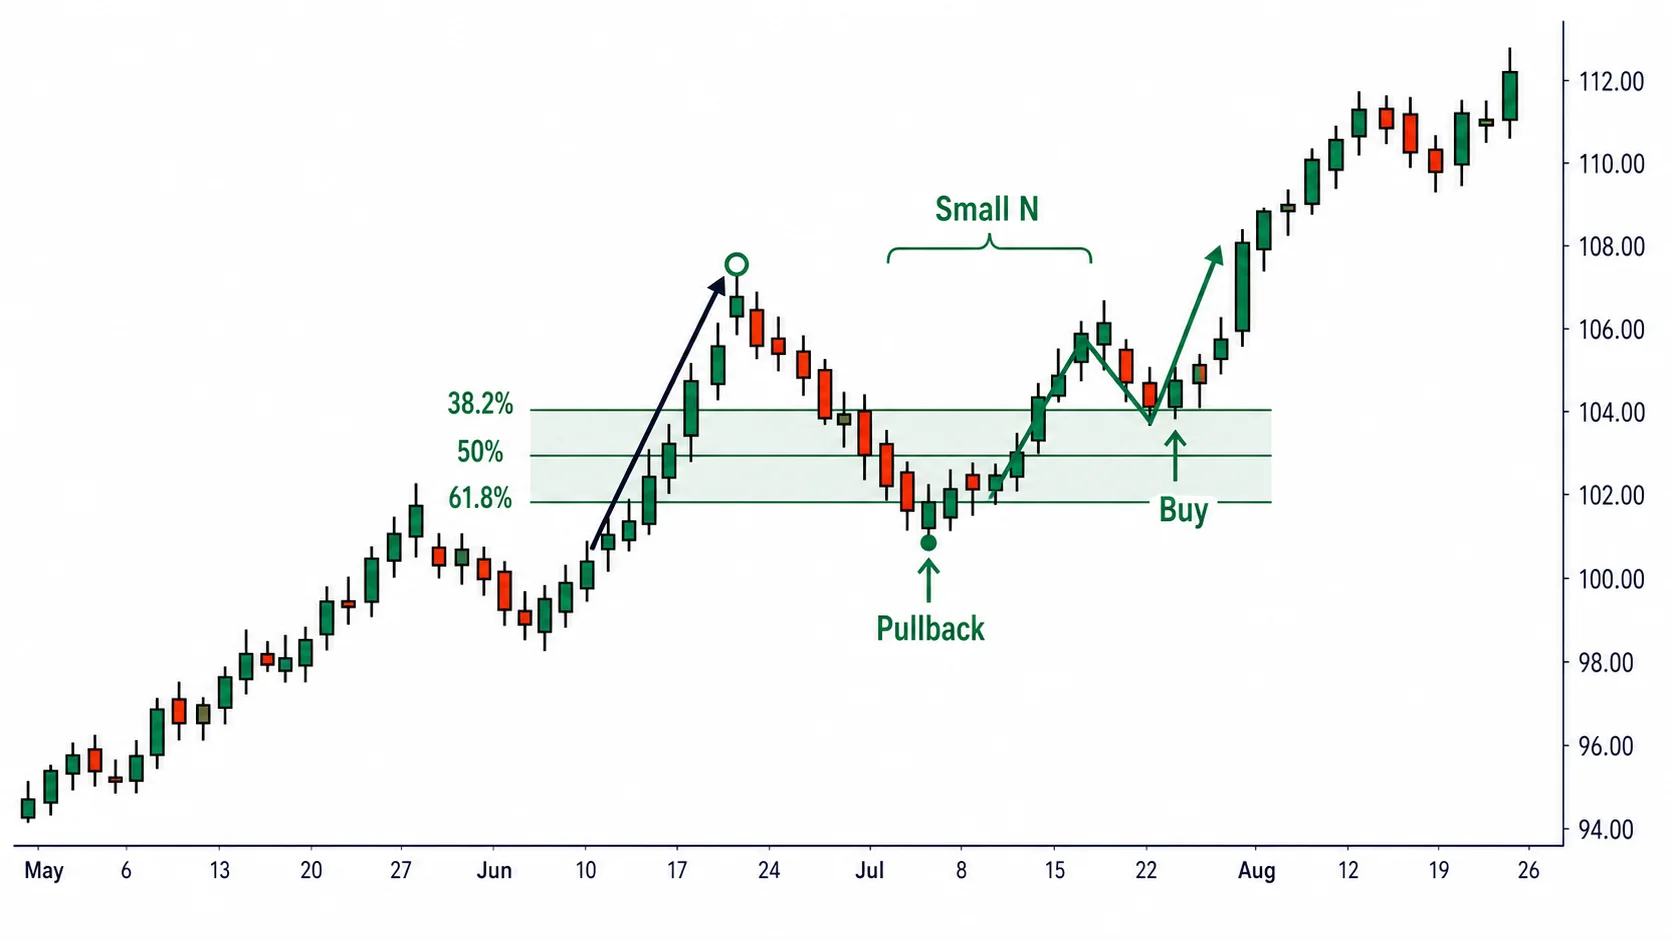
Adding on each small N completion still leaves the entry vague. What pins down how deep a pullback has to run before you add is the Fibonacci retracement. As the large third leg unfolds, price pulls back from time to time, and when that pullback stalls between 38.2% and 61.8% of the prior small rise and completes a new small N-wave, that spot is the entry for the scale-in.
When the pullback is shallow, down to only 38.2%, the trend is strong, so you add early; when it runs deep, between 50% and 61.8%, you add the weight more cautiously. If price clearly breaks below 61.8% and keeps falling, that small rise no longer counts as a stage of the third leg, and you re-examine whether the large move itself is faltering. The depth of the pullback sets both where you enter and how much you add.
For the target, draw N, V, and E together and pick the price where time overlaps
Where you trim the position you built in pieces is also decided by the small waves. First, draw the target price of the large N-wave. The price-target theory (Nehaba Kansoku), covered in Part 9, gives four candidate values. The N target is C+(B−A), the V target is B+(B−C), the E target is B+(B−A), and the NT target is C+(C−A). Drawing only the N target and treating it as the most accurate is a common misconception. Standard practice is to draw all four values and compare which price zone carries the most weight.
These candidate values are not prices that price is guaranteed to reach. They are simply zones where weight tends to gather, and that weight grows when it overlaps with time theory. When the bar count measured by the basic numbers 9, 17, and 26 of the time-theory change days, covered in Part 10, lands on the target price at the same spot, you take that price as the primary target. When the N target and the V target cluster close together and a time change day overlaps that spot as well, it is the heaviest target. The NT target appears rarely, so it gets lower priority. As price approaches this primary target, you prepare to take profit.
Near the target, the lower-timeframe waves give the timing to trim. When price, which had been rising while drawing small N-waves up to that point, has its momentum break near the target on a small retracement leg, that is, on a small V-wave or a single I-wave, the thrust of the third leg has cooled. This is the spot to lighten the position you have built up.
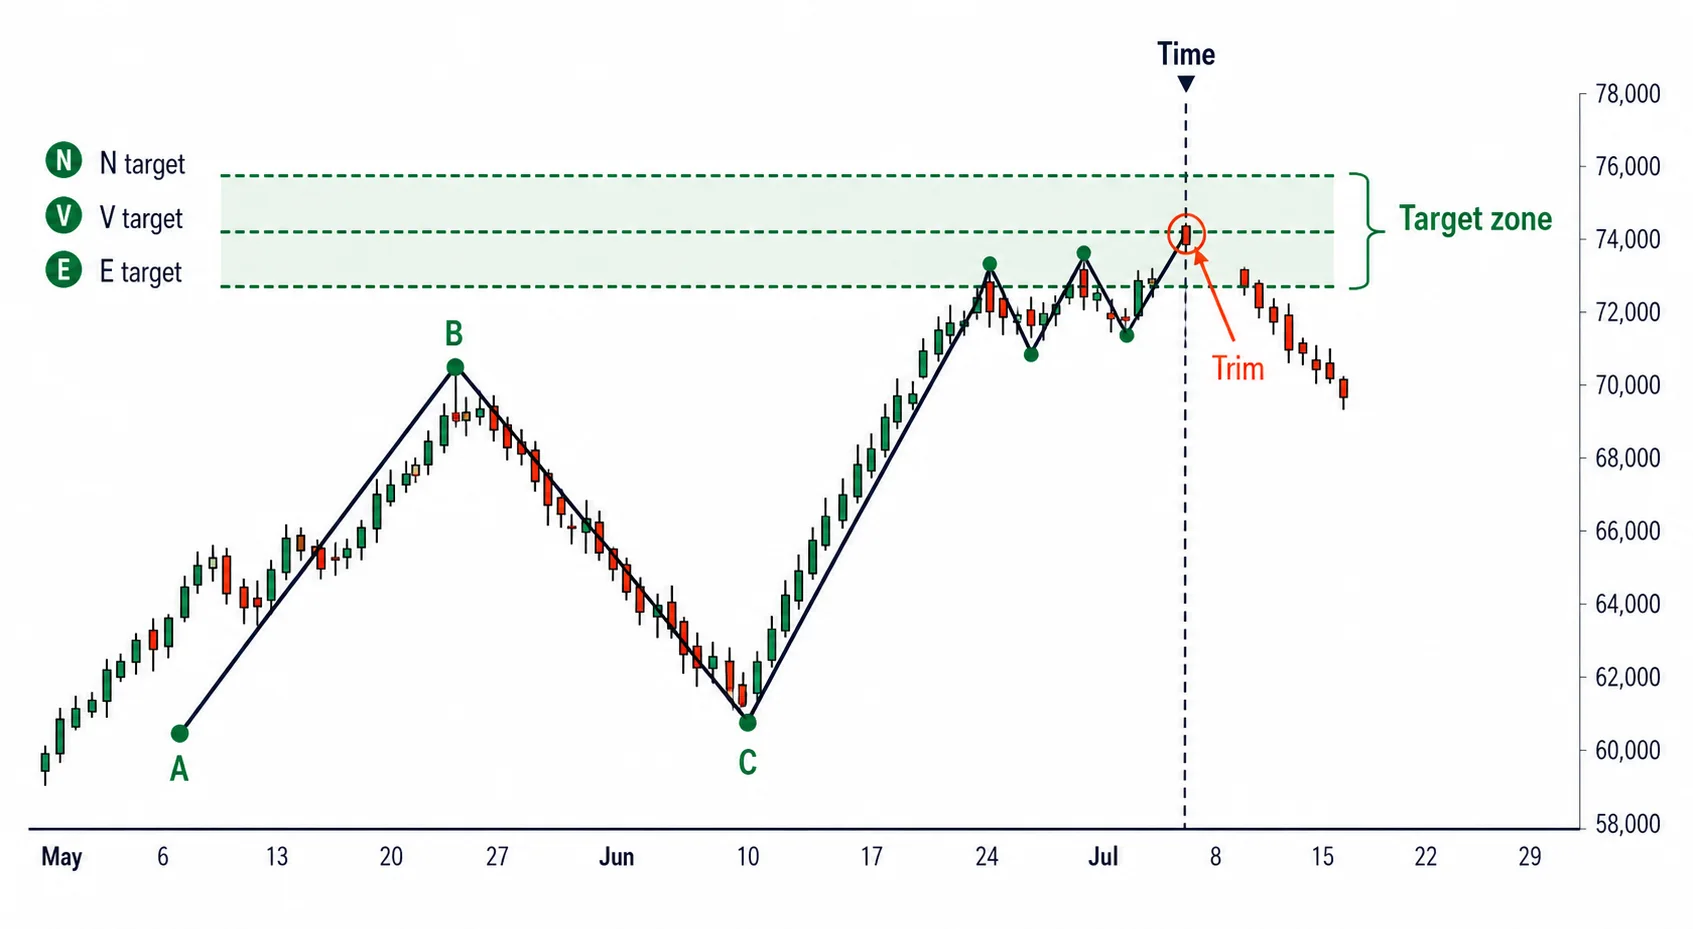
As long as small N-waves keep completing, the move is still going, so you hold the position. The moment a small N fails to appear again and the rise ends on a single leg is the spot to lighten the position. The structure is one where the large target sets the price and the small waves set the timing.
The contracting wave — a range whose amplitude shrinks
Follow the small waves and you find that the amplitude is not constant. The P-wave is a shape in which small N-waves continue but the amplitude shrinks with each pass. The highs step progressively lower and the lows step progressively higher, a triangular range whose upper and lower span narrows toward the center.
When a P-wave appears, read it as a zone where the market is gathering force before committing to a direction. While the span narrows, you bet neither way, and you wait for the moment a close clearly clears the narrowed span to one side. If it clears upward, you resume the small N-wave scale-in; if it breaks downward, you do not treat that spot as a buy.
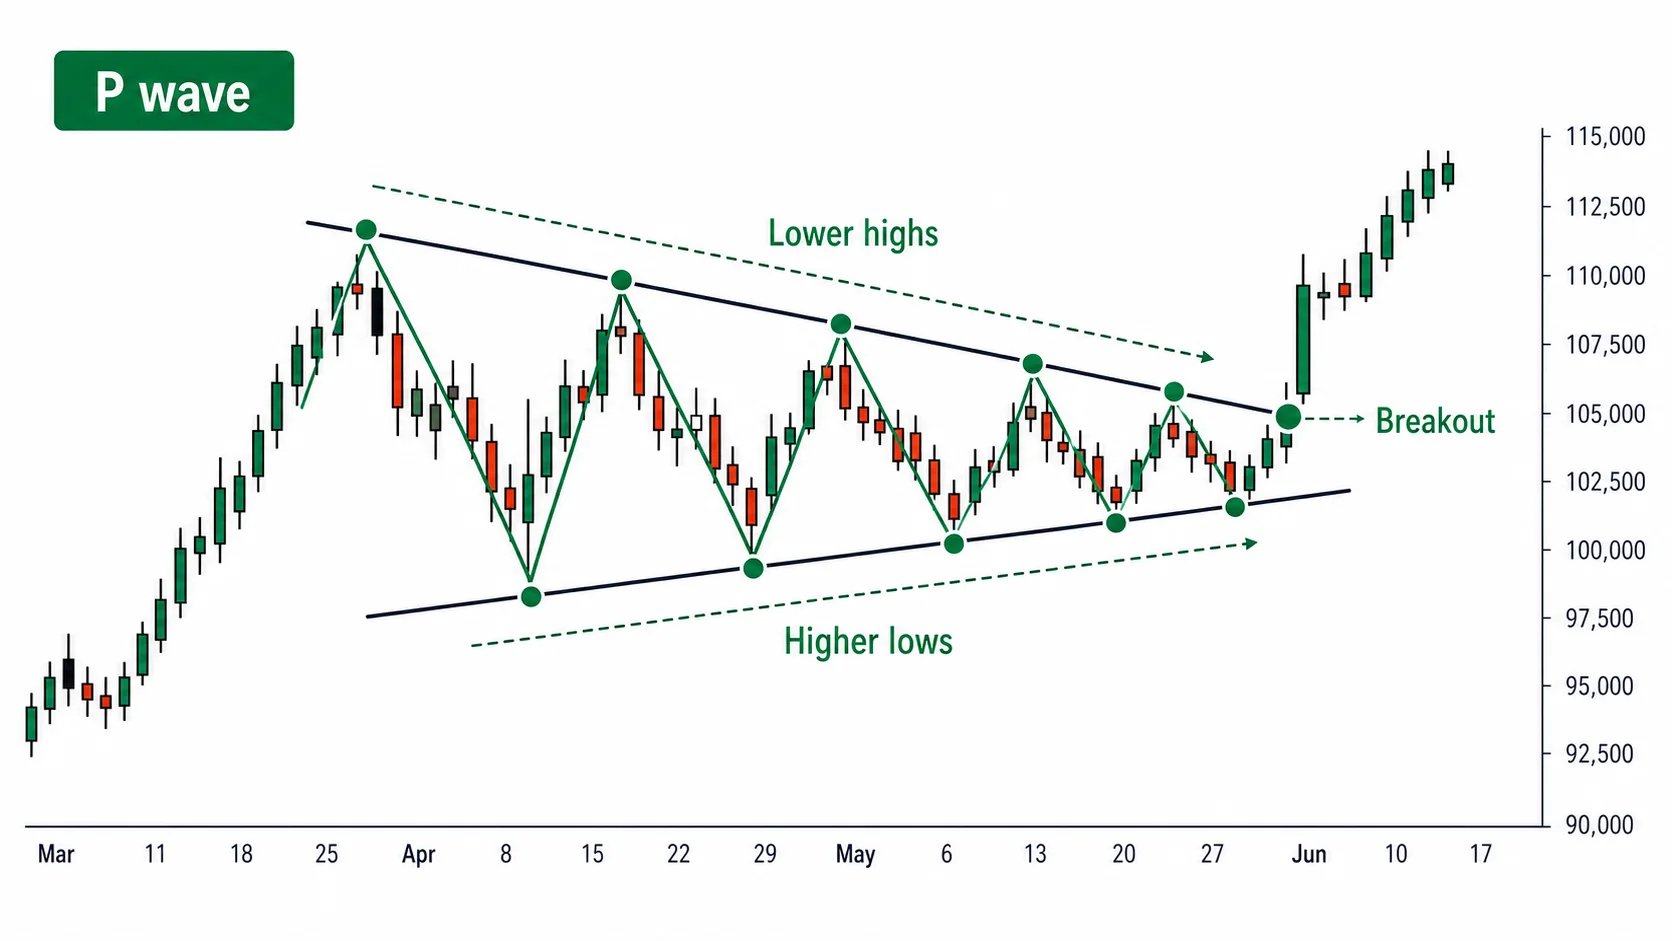
The P-wave appears often between the legs of a large N-wave, especially in the second leg, the pullback zone. When a pullback narrows into a triangle and draws a P-wave, it is often a spot preparing for the third leg.
The expanding wave — a zone of frequent reversals whose amplitude widens
The Y-wave is the inverse of the P-wave. The amplitude of the small N-waves grows larger with each pass. The highs step progressively higher and the lows step progressively lower, so the upper and lower span widens outward.
A widening amplitude means price is swinging hard in both directions. In this zone, even when you catch the completion of a small N-wave, price often gets pushed back hard the other way right away, so the stops on the scale-in trigger frequently. When a Y-wave shows up, read it as a zone where volatility has risen and price flips up and down often, and you reduce the position. While the amplitude is widening, you halt the small-N scale-in and wait for the span to settle down again.
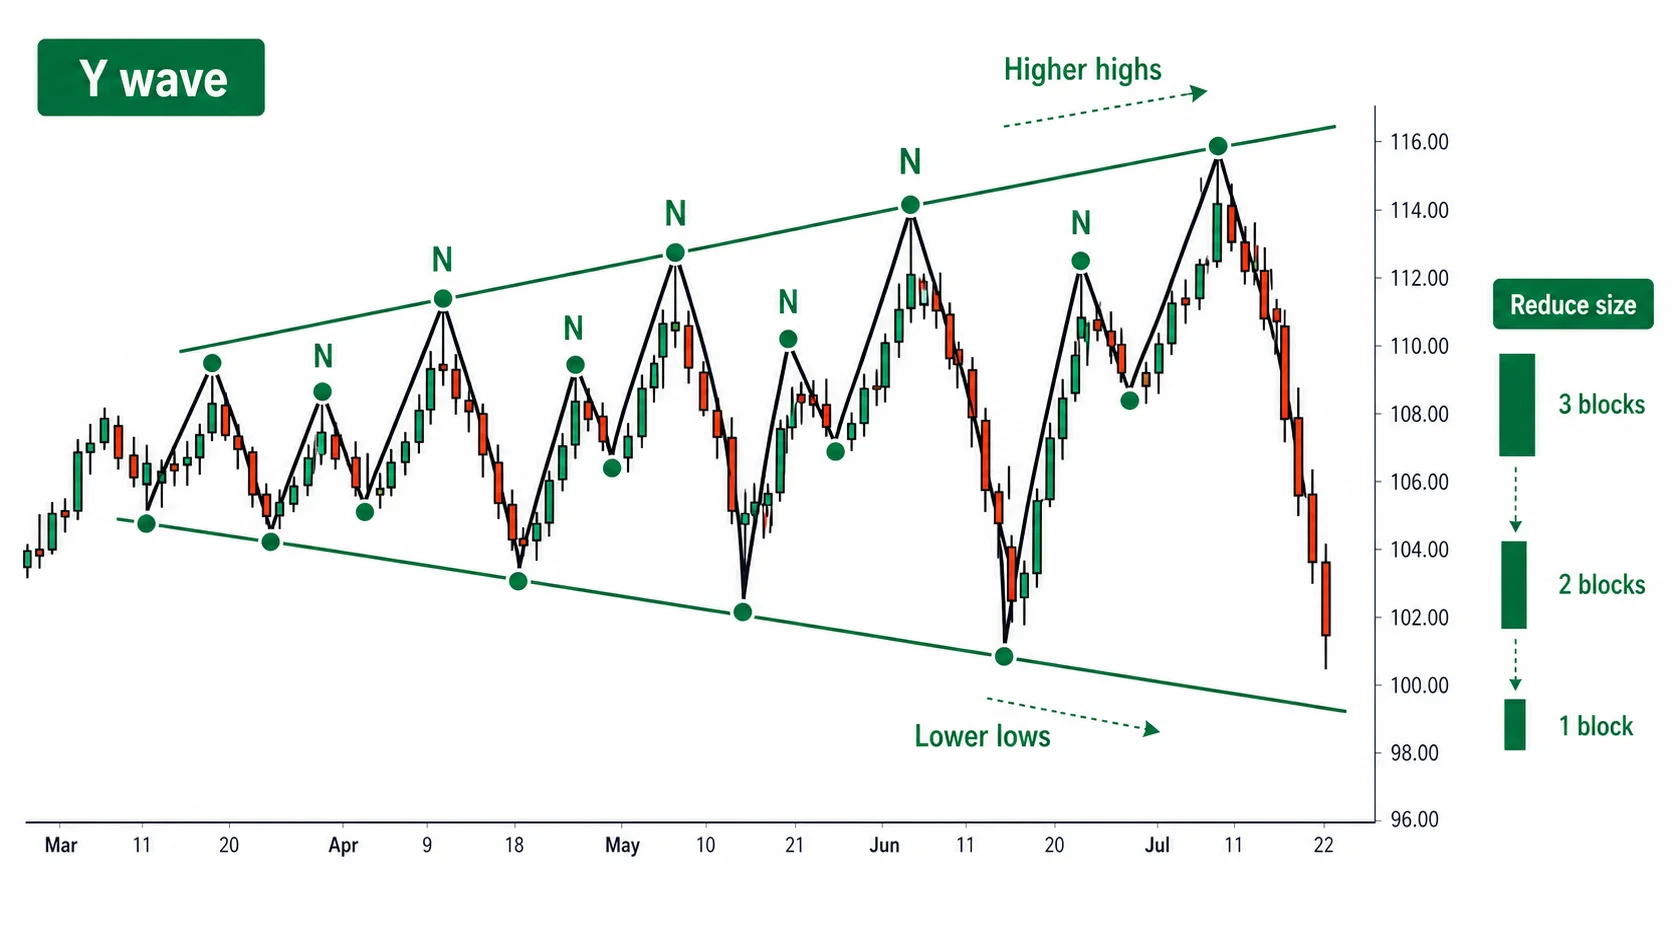
The P-wave and the Y-wave are variations in which small N-waves continue while their amplitude narrows or widens. They are not patterns that appear separately from the small N-waves. So reading these two waves becomes a filter that judges whether volatility is gathering or dispersing right now. The P-wave is a contraction with a direction about to emerge; the Y-wave is an expansion in which you reduce the position.
The role-reversal wave and a misclassification
The S-wave is a shape in which price returns to the level of a past high or low and reacts off that spot. After price clears a high that was once resistance and then comes back down to that level, the level flips into support that props price up. After price breaks below a low that was support and then climbs back to touch that level, the level flips into resistance that holds price down. This switching of the same price level from support to resistance and from resistance to support is the S-wave.
In the scale-in, the S-wave pinpoints where to buy on a retracement. While the third leg of a large N-wave is rising and price pulls back to the level of a high that was once resistance, that level flips into support and props price up. This spot often overlaps with the Fibonacci retracement band seen earlier, and when a small N-wave completes again at that level, you resume the scale-in once more.
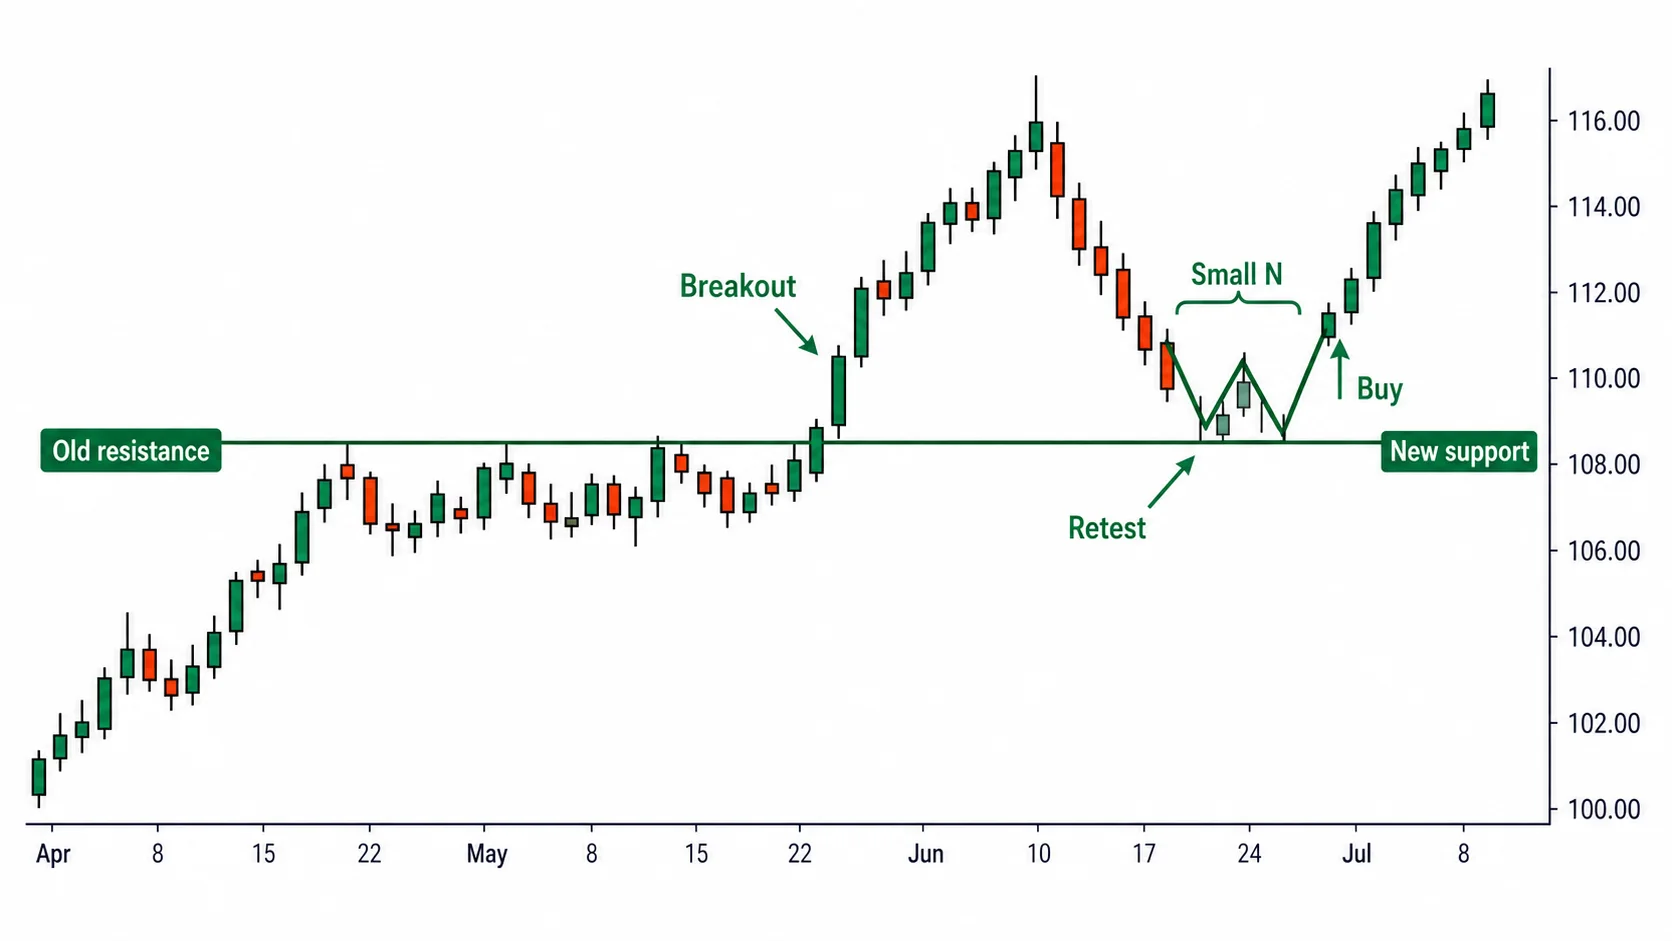
One classification needs to be made clear. Some sources call the S-wave an expanding wave, and that is a misclassification. The expansion whose amplitude widens outward is the Y-wave. The S-wave is a role reversal at a past price level. The two are different waves, so the S-wave should not be read as an expanding wave.
Even in the scale-in, watch out for the counting trap
When you split waves across several timeframes, you get more small highs and lows to count. That also widens the room to pick a reference wave arbitrarily. The counting trap covered in Part 6, namely the arbitrary choice of standard that counts only the waves you like and the hindsight bias of fitting things after the fact, gets easier to fall into the further down you go into the small timeframes.
The way to cut this down is to fix the larger timeframe first. Once you have clearly set A, B, and C of the large N-wave on the daily chart, you count the small N-waves only in the direction of that large leg. If the large third leg is up, then on the small timeframe you take only upward N-waves as the basis for the scale-in, and you do not count small retracements as entry spots. The structure is one where the large frame reins in the arbitrariness of the small counting.
If the large N-wave has already reached the N target and the third leg is nearly finished, then even if a small N-wave completes once more you do not start a new scale-in. Buying more on the strength of a small completion alone, in a zone where the large move has already arrived at its target, means loading weight at the tail end. Small waves are read only within the position of the large wave.
The short is the same structure flipped top to bottom
So far we have looked at the case where the large N-wave rises. In a decline, only the direction of the large N-wave changes. It is the zone where the large N-wave falls from high A to low B, rises from B to the retracement high C, and then the third down-leg unfolds, falling again from C.
Within this third down-leg, you sell in pieces each time a small downward N-wave completes. When the retracement stalls between 38.2% and 61.8% of the prior small drop and completes a new small downward N-wave, that spot is the entry for the scale-out short. For the target, you draw the four candidate values, including the downward N target C−(A−B), together and take the price that overlaps a time-theory change day as the primary target. When the small downward N-waves that had been continuing fail to appear and the downward momentum breaks on a small retracement leg, you lighten the position.
The P-wave is the same contracting range. Just as a break upward resumes the scale-in buy in an up context, in a down context a close that breaks the narrowed span downward is the basis for the short scale-in at that spot. The Y-wave is a zone where volatility rises and price flips frequently on both sides, so you reduce the position.
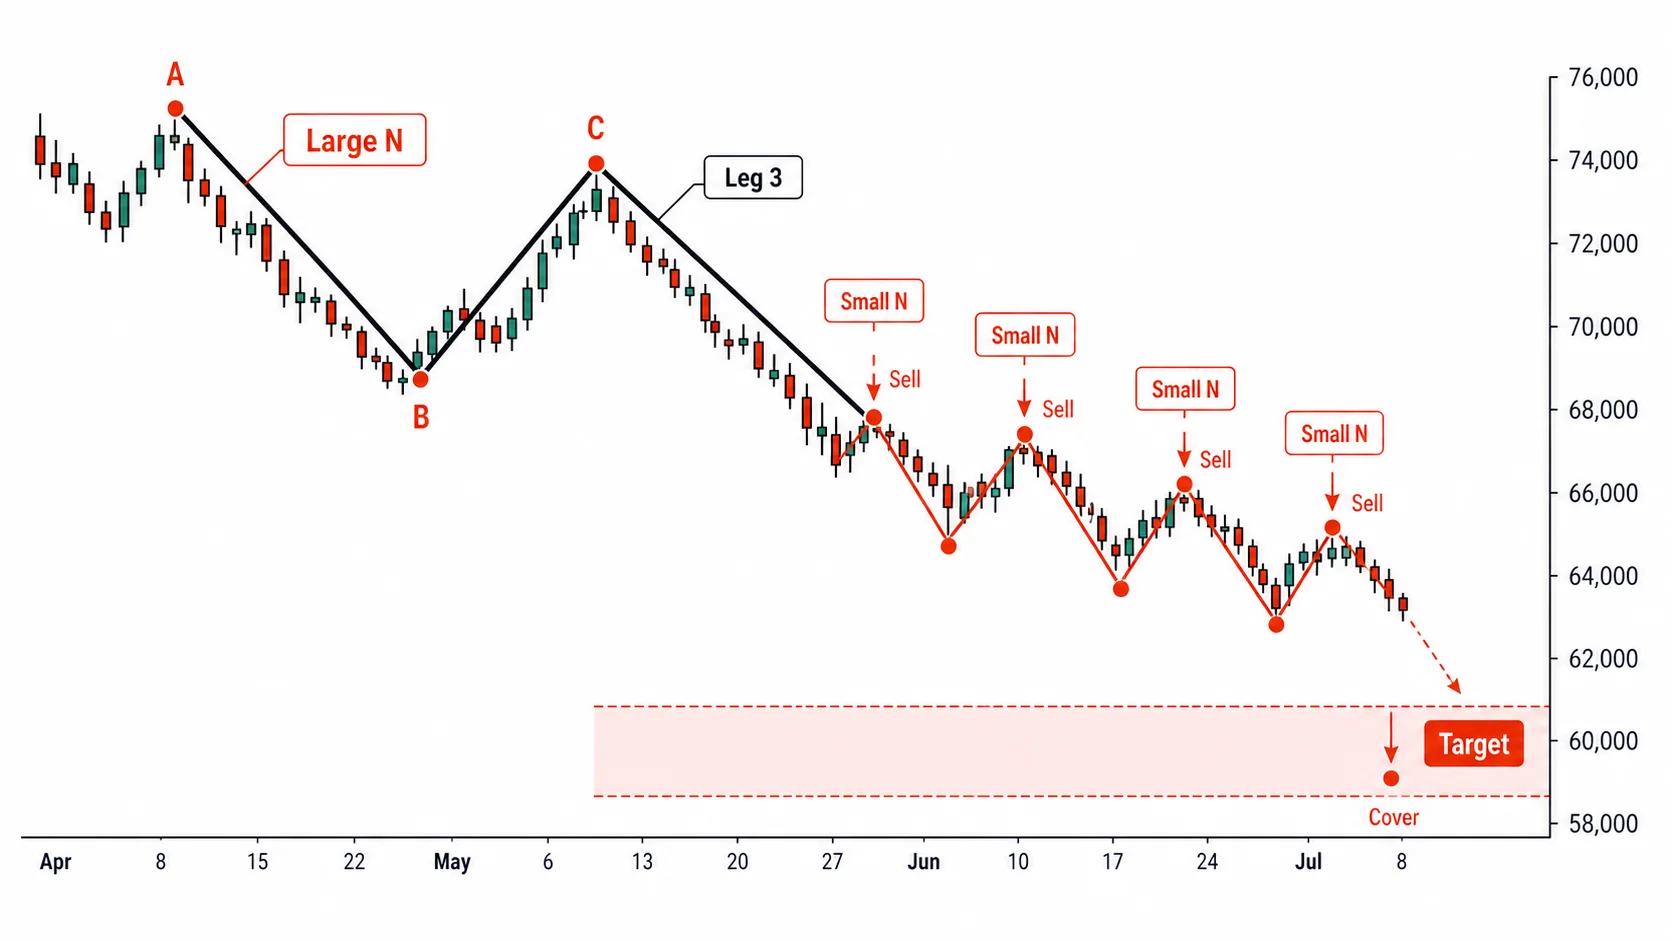
The structure of using the large N to set direction and target and the small N to set entry and exit spots holds even when top and bottom are flipped.