OptiNod Academy
Ichimoku — N-Waves vs Elliott
Both read a trend as a sequence of waves, but Elliott fixes the count at 5+3 while Ichimoku takes the N as its basic unit and keeps the count simple.
Ichimoku wave theory (hadōron) and Elliott Wave both treat a trend as a sequence of waves, but they count those waves differently. Elliott fixes the count at eight: a five-wave impulse and a three-wave correction. Ichimoku takes the N — a three-leg move — as the basic unit of a trend and never fixes how many there are. It keeps the count simple, then layers price-target theory and time theory on top to read both the price objective and the timing.
Start with Elliott Wave
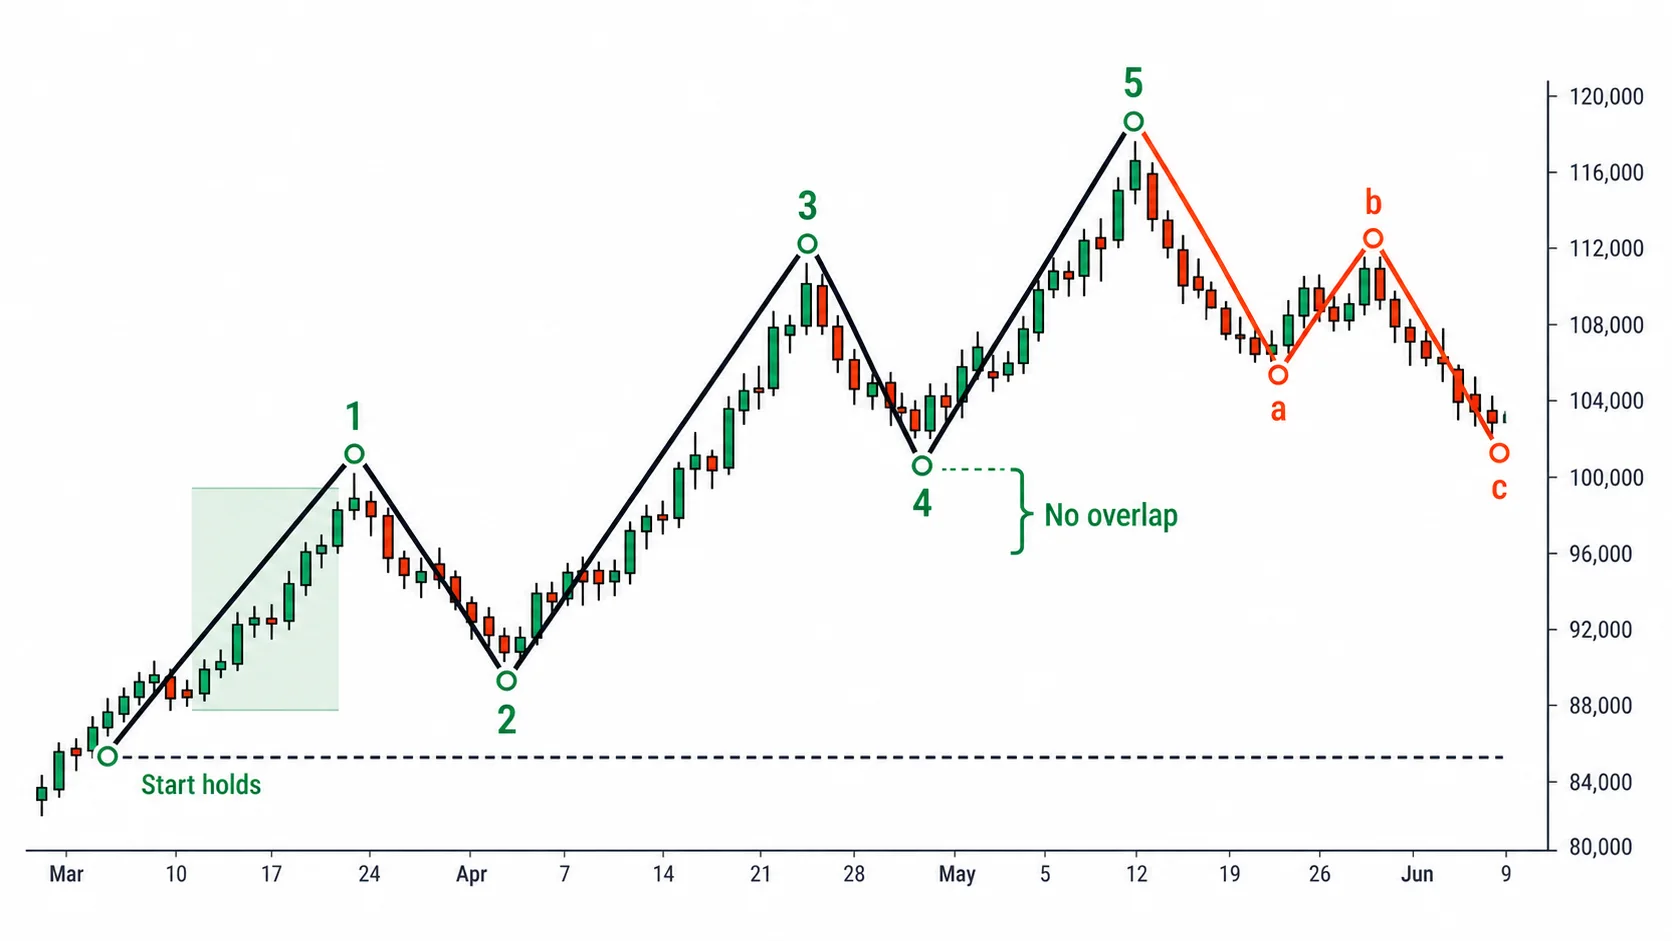
Elliott Wave reads a full trend cycle as eight waves: a five-wave impulse that advances with the trend, followed by a three-wave correction that retraces it. The impulse waves are labeled 1, 2, 3, 4, 5 — of which 1, 3, 5 push with the trend and 2, 4 pull back against it. The corrective waves are labeled a, b, c.
Elliott sets rules that each wave must obey. Wave 2 cannot fall below the start of wave 1. Wave 3 cannot be the shortest of waves 1, 3, 5. Wave 4 cannot trade into the price territory of wave 1. Break even one of these three rules and the count is wrong, so the labeling has to start over from scratch.
Ratios attach to this as well. Wave 2 retraces 38.2% or 61.8% of wave 1, wave 3 extends as far as 1.618 times wave 1, and corrections are measured for depth against the Fibonacci sequence. Because the count has to satisfy both the rules and the ratios, it is dense, and when it goes wrong the labels are reassigned.
Elliott deals with the shape and the ratios of the waves. It estimates what form a wave takes and how far it extends, and it sets price objectives by ratio — but it offers no theory of timing for when price reaches that objective.
Ichimoku wave theory takes the N as the basic unit of a trend
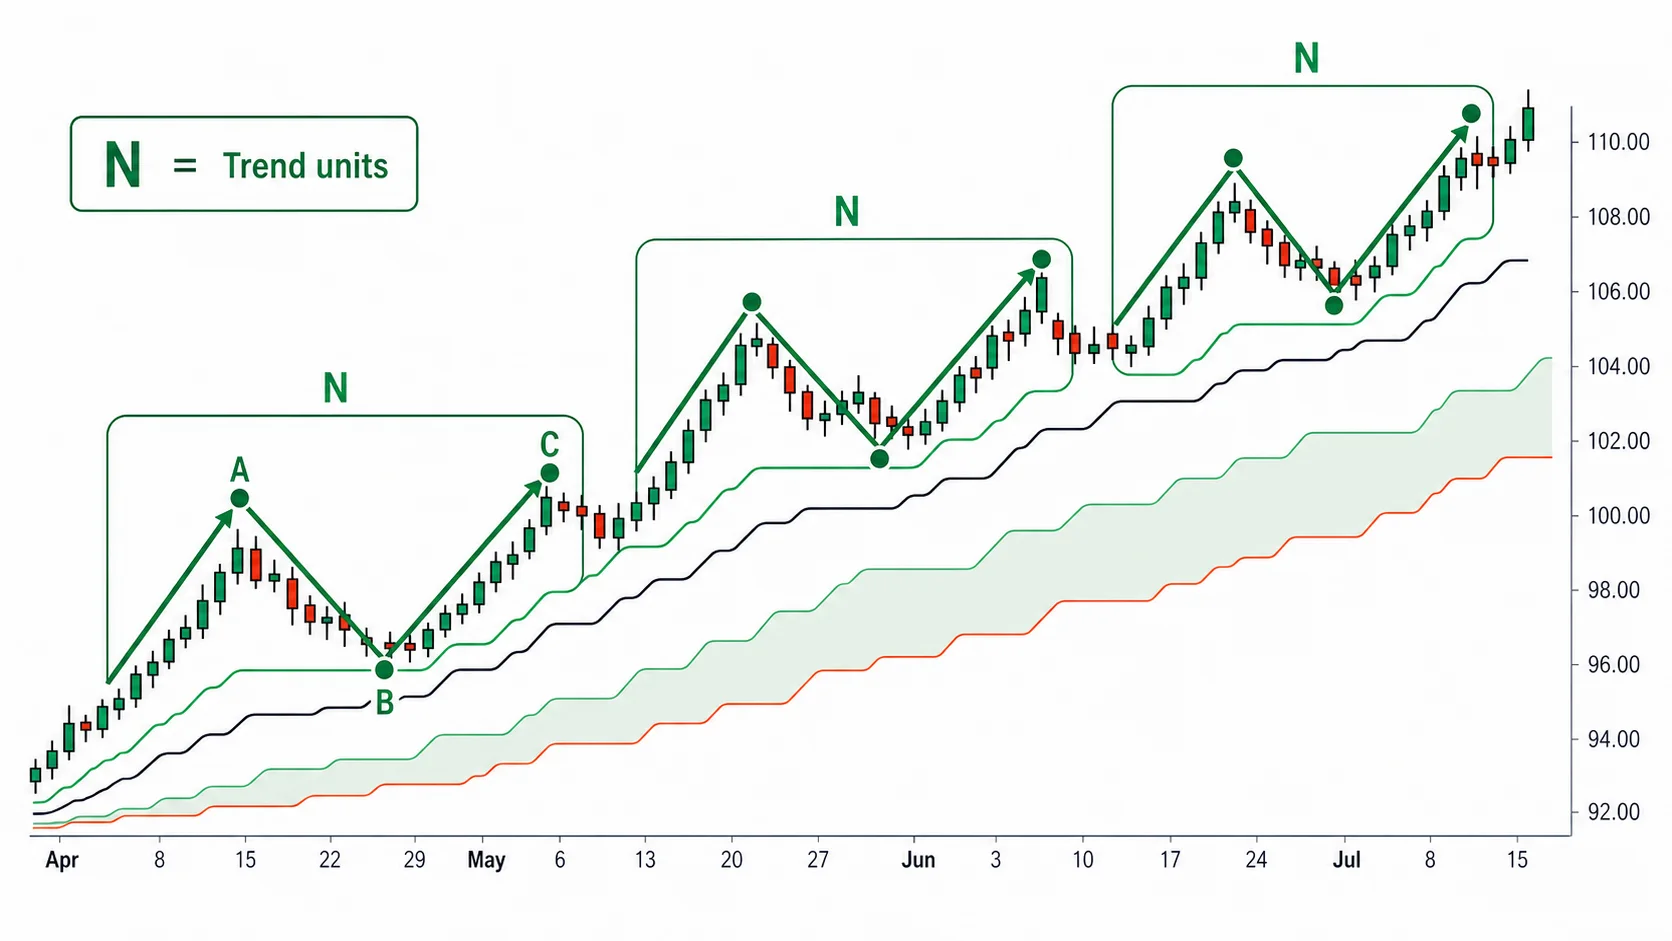
Ichimoku wave theory begins, as covered in Part 6, with three shapes: I, V, and N. The I is a single move in one direction, the V is a two-leg move that goes and comes back, and the N is a three-leg move that rises, pulls back, then rises again. Of these three, the N is the basic unit of a trend.
The N is the basic unit because it holds both a thrust and a retracement in one package. The three legs — rise, pullback, rise again — are the smallest complete form by which a trend advances one step. A long trend reads as several of these N's joined end to end, and the I and the V are unfinished forms on the way to an N.
Ichimoku does not decide the wave count in advance. Elliott groups one cycle as 5 + 3; Ichimoku does not fix how many N's will follow but counts one step each time an N completes. If the trend is long, the N's repeat several times; if short, it ends in one. Because no frame is placed on the count, there is also little need to reassign labels after the fact.
Completing an N carries one condition. The final, third leg must exceed the prior high before the N is complete. Even after a rise, a pullback, and another rise, if it fails to exceed the prior high it is not yet an N — it is a retracement at the V stage. This is why a simple zigzag does not count as an N.
Where the two wave theories resemble each other
The two theories share the same idea at the root. Neither draws a trend as a single straight line; both read it as a sequence of waves. Within a trend, moves that push with the direction alternate with moves that retrace against it, and reading the two separately is common to both.
Elliott's waves 1, 3, 5 and the first and third legs of the Ichimoku N are the parts that push with the trend, while Elliott's waves 2, 4 and the second leg of the N are the parts that retrace. The reading is similar too: if the retracement ends shallow the trend carries on, and if it erases the prior thrust entirely the trend has turned.
Judging a trend by its extremes is also shared. Elliott holds that the trend stays intact as long as wave 2 does not break the start of wave 1, and Ichimoku holds that the trend has advanced one step once the third leg of the N exceeds the prior high. The skeleton — judging the trend by whether the prior extreme holds or is exceeded — is present in both.
The habit of measuring retracement depth with Fibonacci ratios is shared as well. Both watch whether the retracement halts between 38.2% and 61.8% of the prior thrust, and that holds equally when reading the second leg of the Ichimoku N.
The weight of the counting differs
The difference lies in the weight of the counting. Elliott fixes the wave count at 5 + 3 and must satisfy the rules and ratios for each wave, so the count is dense. When a move breaks a rule, the labels assigned earlier are erased and the count starts over from the beginning. On the same chart, different people count in different ways, and which count was right often gets settled only after more of the move has played out.
Ichimoku keeps just one N as the basic unit and does not fix the count, so the count is simple. Once three legs gather and the final leg exceeds the prior high, one N is complete — no counting against several rules. Hosoda put simplicity and clarity first in wave theory. The form is kept simple so that anyone looking points to the same place.
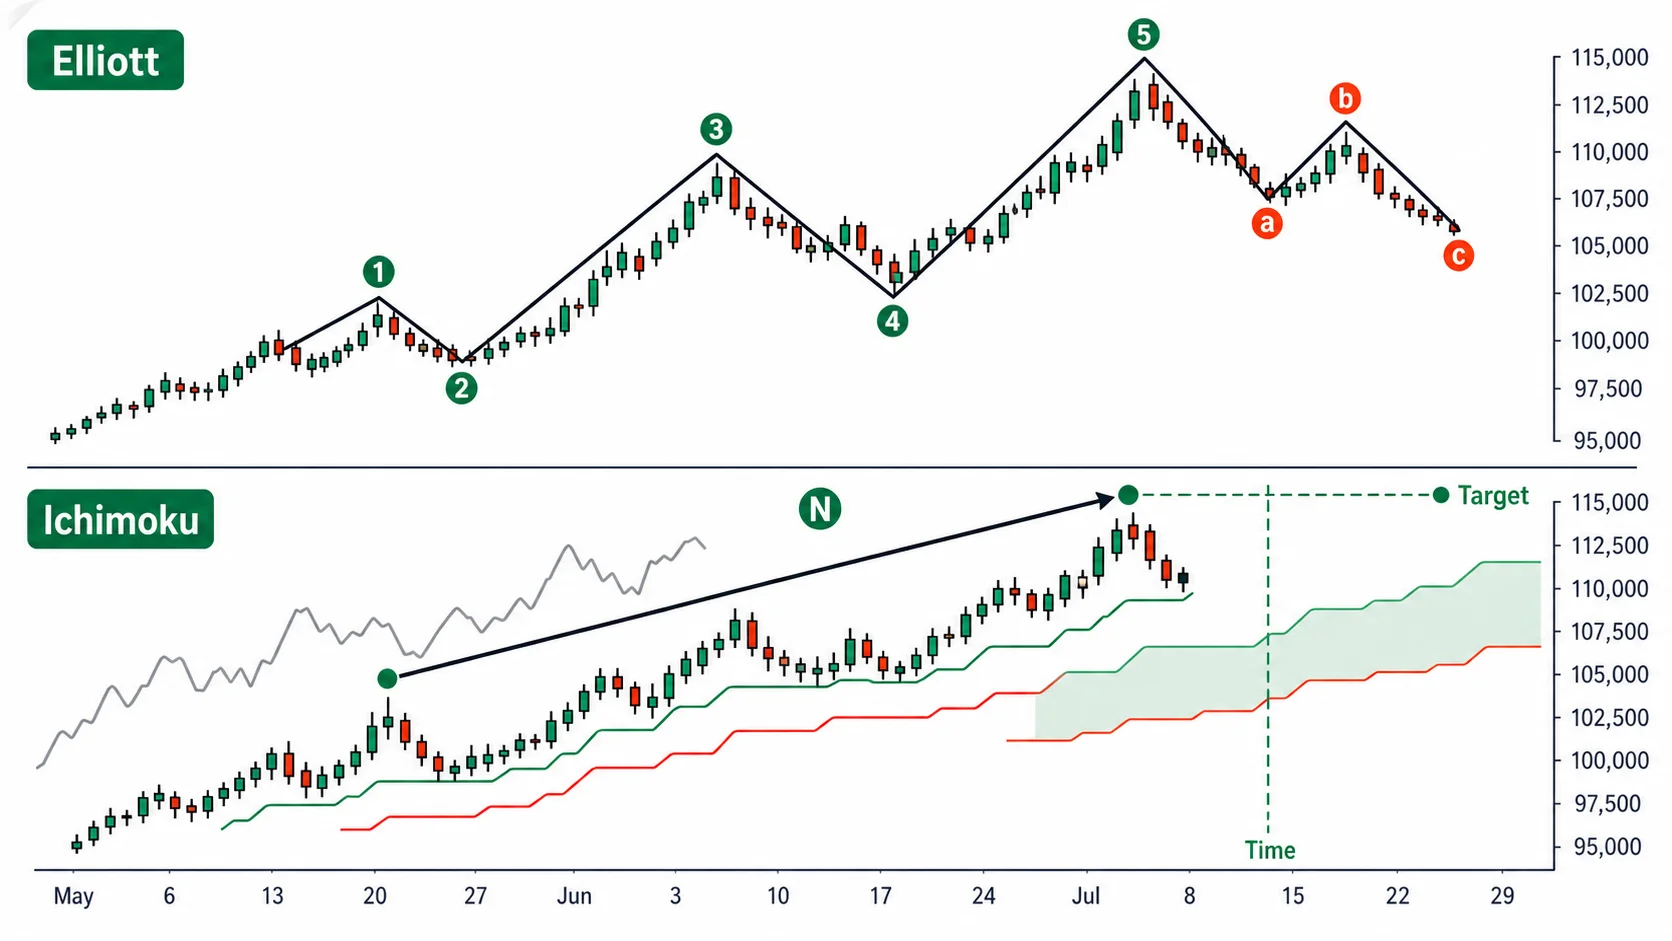
Ichimoku does not stop at counting the form. Once an N completes, price-target theory (Nehaba Kansoku), covered in Part 9, draws the next objective, and time theory, covered in Part 10, reads the timing at which a change will appear. Elliott estimates how far price will go by form and ratio. Ichimoku binds price-target theory and time theory to the form, reading together how far price will go and when that point will come. Having a separate theory for timing is the largest difference from Elliott.
What to take
The simple identification of the Ichimoku N is the easier side to handle in practice. A detailed Elliott count must satisfy every rule and is frequently re-labeled after the fact. Because the right count is settled only after more of the move has played out, it is hard during a trade to pin down which wave the market is on. The N judges completion by three legs and one break of the prior high, so it reaches a conclusion quickly in front of the chart.
Adding price target and time on top of this means the work does not stop at judging the form but reads the objective and the timing too. Where an N completes, the calculated value from price-target theory is drawn to set the next objective, and more weight goes on a price band that overlaps with a change day from time theory. Elliott's Fibonacci projection also sets a price objective, but it can be drawn only once the wave labels are confirmed, so it arrives slightly later. The Ichimoku price-target value is a candidate drawn the moment the three points making up the N are plotted, and its reliability rises when it overlaps with a time-theory change day. It is not a price guaranteed to be reached — it is a candidate place to weight.
Counting both methods on one chart is confusing. You keep trying to match which part of an Elliott five-wave count maps to which leg of the Ichimoku N, and the rules of one side shake the judgment of the other. Understanding the two by comparison and counting them at once on one chart are separate matters. Settle on one count, and keep the other only as a reference for comparison.
The same frame applies to shorts
In a decline the frame simply flips. A fall, one bounce, then a fall again that breaks the prior low completes a down N. Watching whether the second leg's bounce halts between 38.2% and 61.8% of the prior decline is the same as in a rise. If the bounce halts without breaking the prior low, it is not yet a down N — it is at the retracement stage.
Elliott flips the same way in a downtrend, with the five-wave impulse pointing down and the three-wave correction retracing up. Both theories use the same frame with only the direction reversed, yet the Ichimoku side stays the simpler count in a decline as well. Once a down N completes, price-target theory projects downward to set the next support objective, and weight goes where it overlaps with a time-theory change day.