OptiNod Academy
Ichimoku — N, V, E, and NT Targets
Mark the starting low A, high B, and pullback low C to draw four targets — N, V, E, NT — and use the zone where they overlap as your first take-profit.
A price target is not a line you draw on instinct. Mark three points — the starting low A, the high B, and the pullback low C — and four targets (N, V, E, NT) appear at once. The zone where those values cluster onto a single price becomes your first take-profit and risk-reduction area.
The Question Price-Target Theory Answers
The three pillars of Ichimoku Kinko Hyo are time theory, wave theory, and price-target theory (Nehaba Kansoku). Time theory looks at when a change arrives; wave theory looks at what shape price moves in. Price-target theory answers the final question: once price has committed to one direction, how far does it go.
Goichi Hosoda did not set these targets by feel. He measured the width of a move that had already finished and projected the coming move to travel an equal distance. The idea is rooted in balance. He saw the market lean to one side and then fill the same amount in the opposite direction to restore equilibrium, which meant a width the market had produced tended to repeat at the same size on the next leg. If the market has rallied 600 points, there is room for a comparable 600-point rally on the following leg. Price-target theory computes this "equal width" in four ways and lays down all the target candidates at once.
The four targets are candidates where price might stop — approximations. They do not guarantee that price will reach them. Their reliability rises when several of them overlap or when they coincide with a change day from time theory. Parts 10 and 13 cover this point.
Mark A, B, and C Precisely First
All four targets come from three points. If you mark these three points wrong, the targets miss even when the formula is correct, so you must pin down A, B, and C precisely first.
A is the low where the trend began. It is the low from which the advance started. B is the first high that advance produced. It is the high reached after rising from A, just before the first pause. C is the pullback low after B. It is the low after price pulls back from the high B. In short, price rises from A to B, pulls back to C, and you compute the target at the point where it tries to move up again.
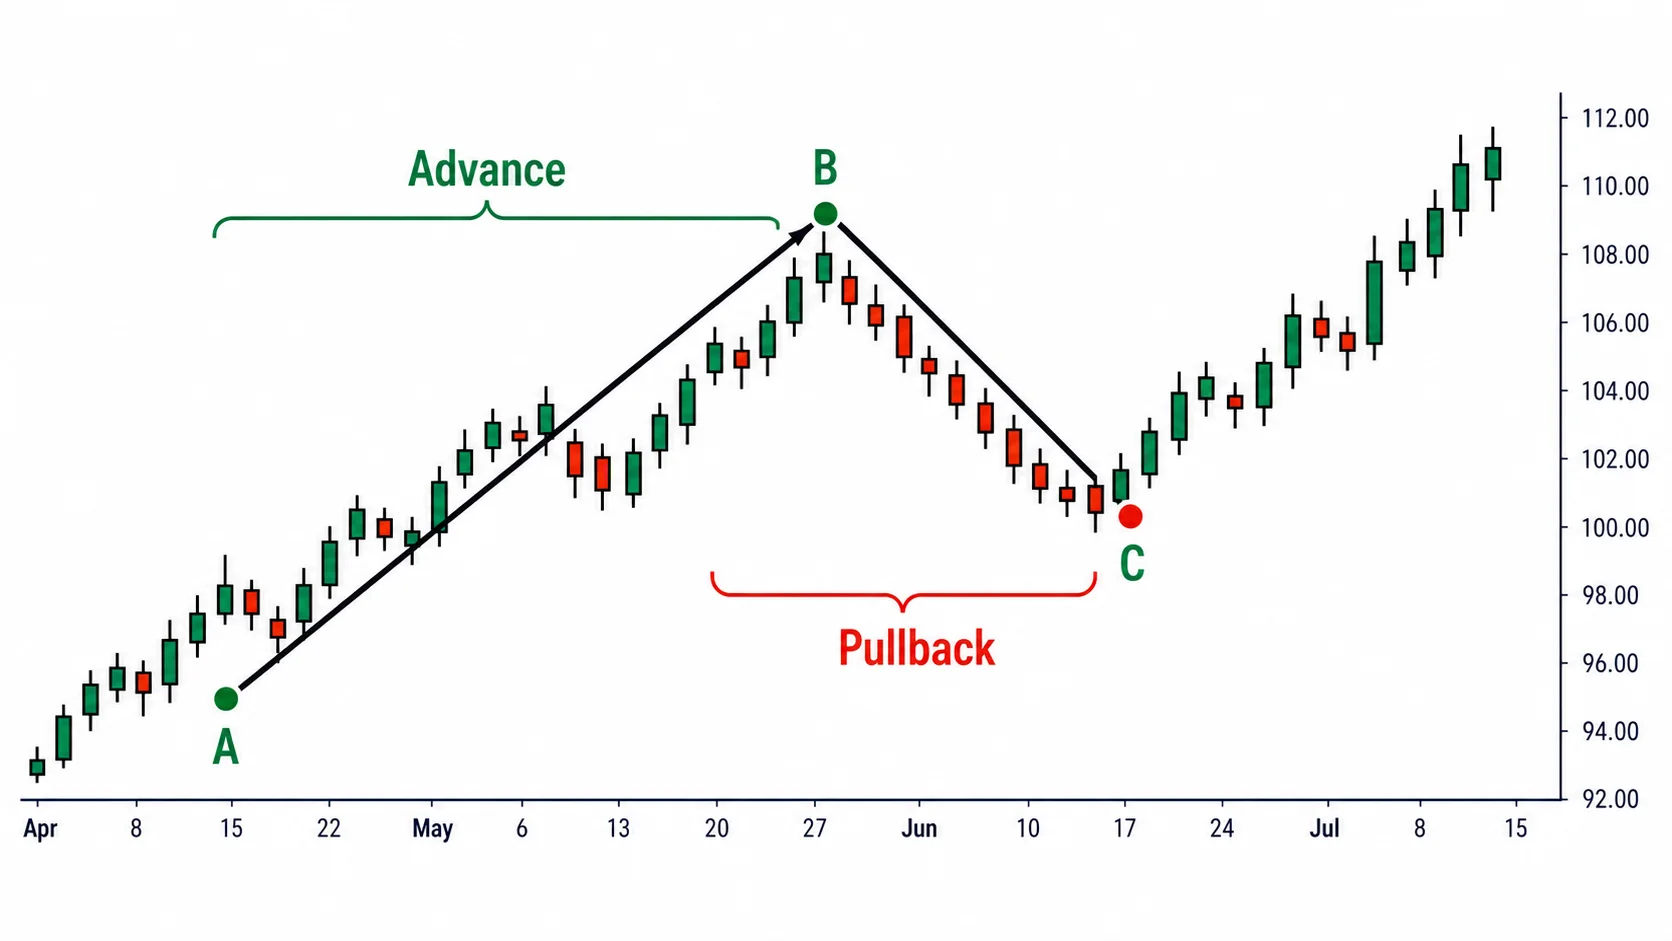
The most common mistake here is confusing A and C. Both are lows, so they look alike. A is the earlier starting low, and C is the later pullback low. C sits higher than A, because a pullback within an advance stops above the starting point. Swapping A and C throws off all four formulas, so fix the order: the earlier low is A, the later low is C.
The N Target — The Most Common Base Target
The first target is N. The formula is N = C + (B − A). You add the first advance width A-to-B (B−A) onto the pullback low C.
The reasoning is simple. The width the market rallied from A to B is the basic driving force of that move. When price advances again from C, there is room to produce that same width once more. Starting from C and adding the first advance width gives a target of C + (B − A).
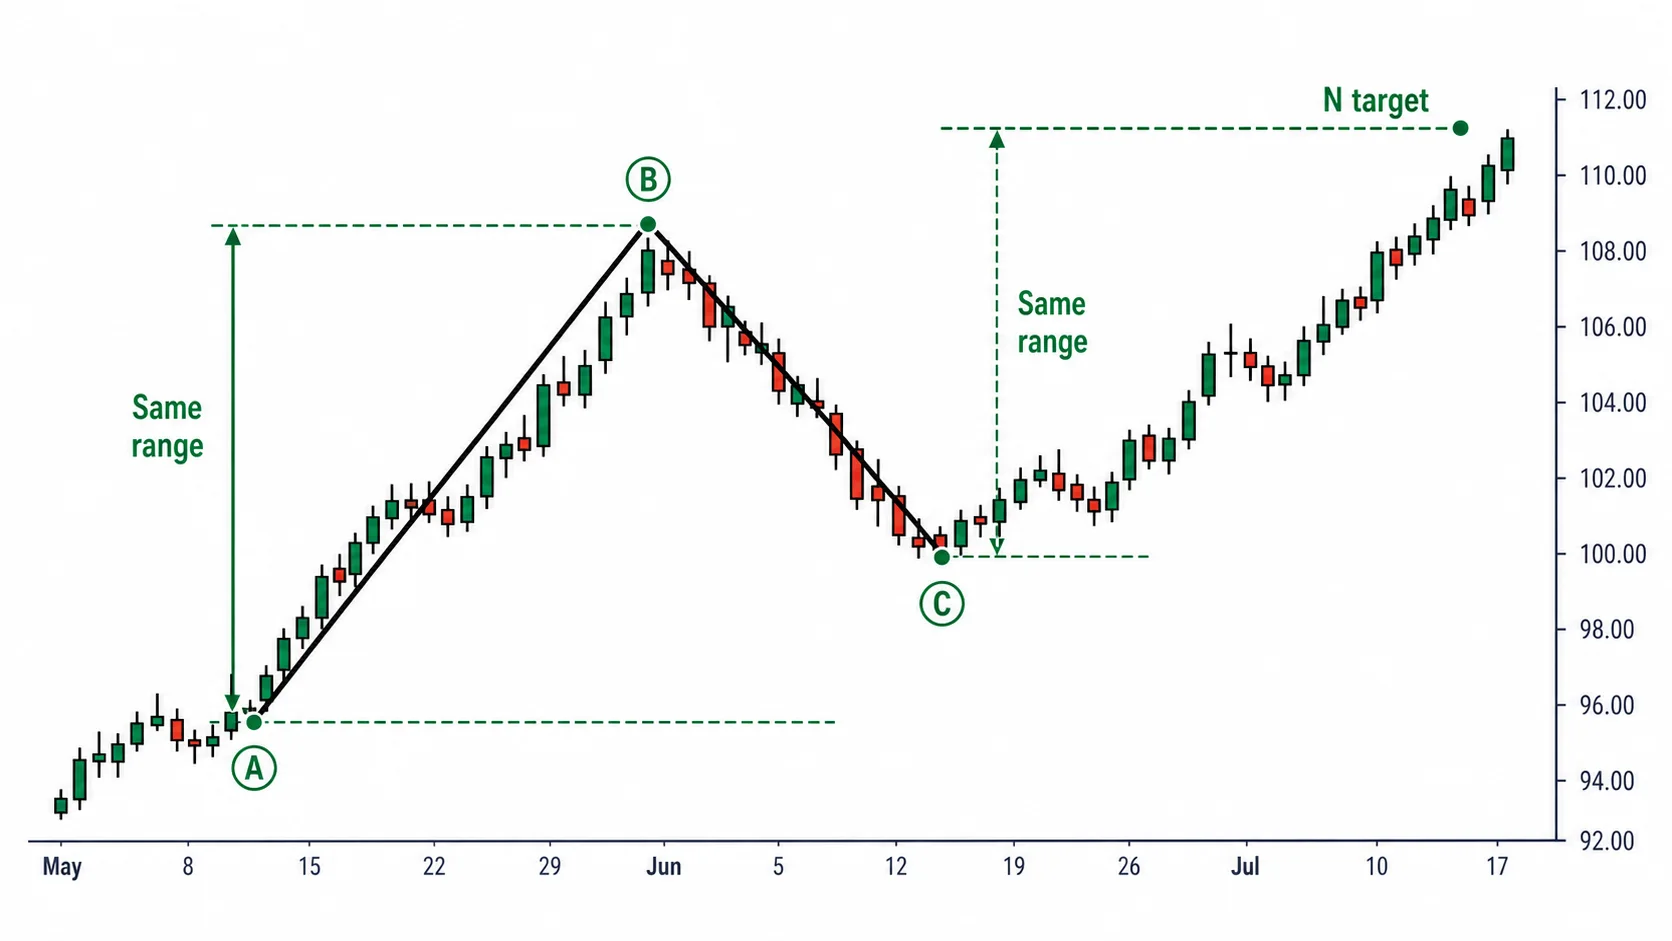
N is the most frequent base target of the four. Because it uses only the first advance width regardless of whether the pullback C is deep or shallow, it fits reasonably well in any market. So before weighing the other values, draw N first as your base target.
The V Target — A Target From Deep Pullbacks
The second is V. The formula is V = B + (B − C). You add the pullback width B-to-C (B−C) onto the high B once more.
Adding the pullback width back on top of the high is why it is called 倍返し (a double payback). The V in the name does not refer to a V-shaped rebound. It means that the 押し目 — the decline from B down to C — is paid back twofold. After rising from C back to B, price advances a further B−C, so you add the pullback width onto B twice over. The deeper the pullback (the larger B−C), the higher V sits.
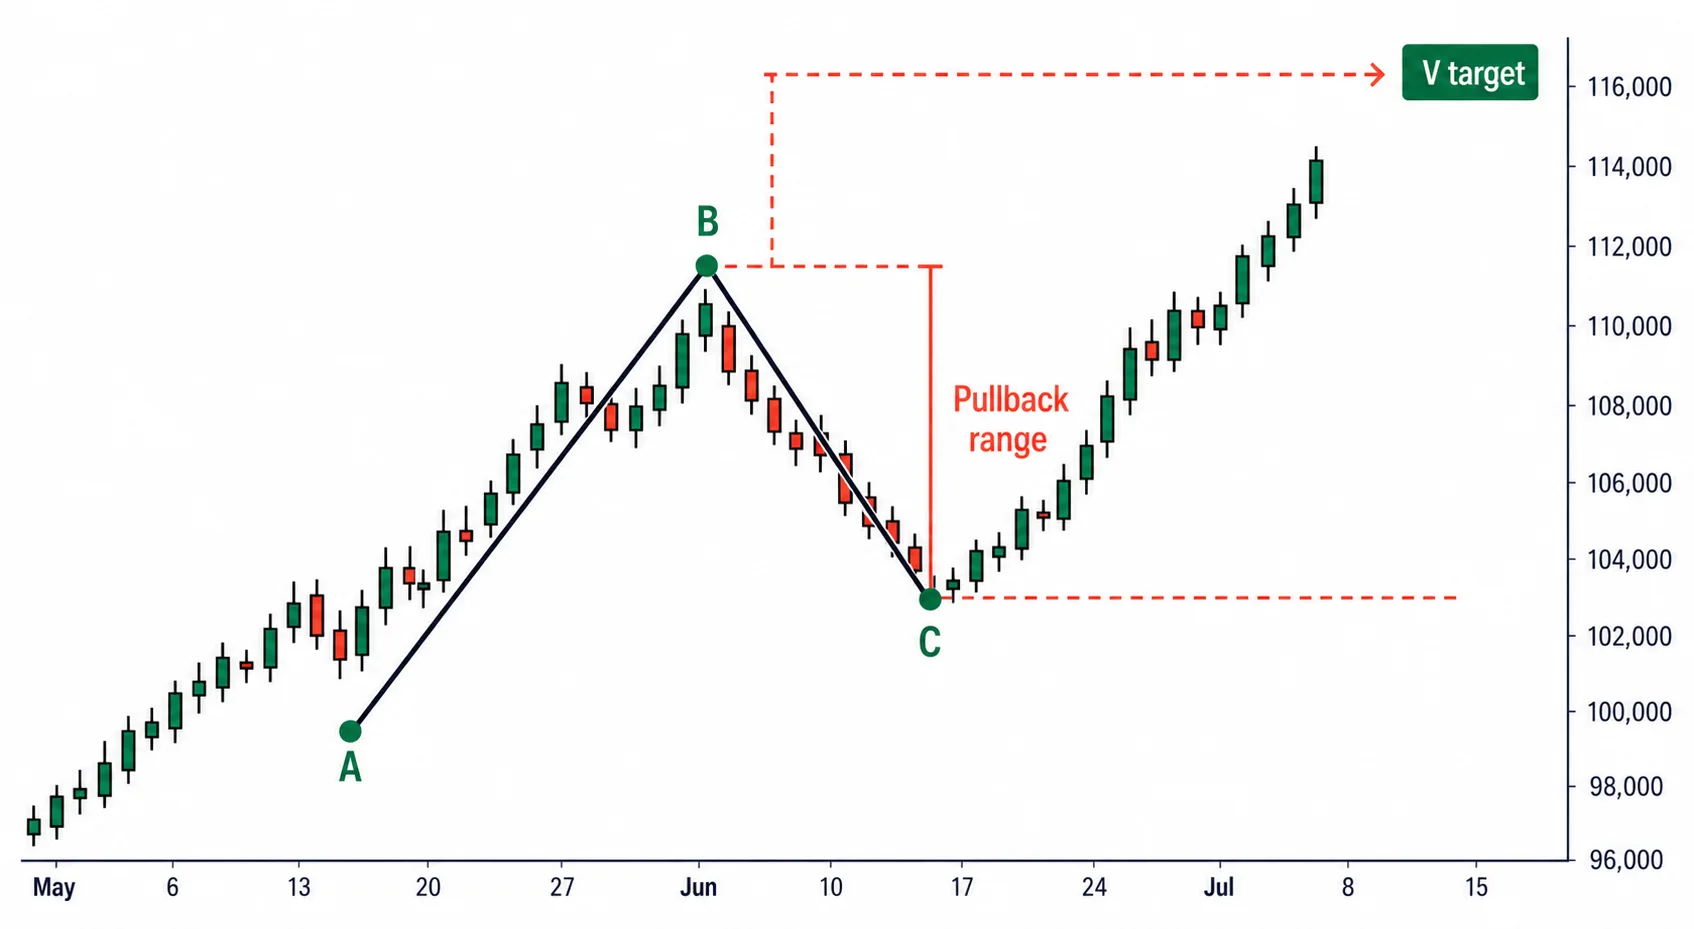
V is the target to use when the pullback is deep. A deep pullback means price was shaken out hard and is now rising again, so the rebound width is set correspondingly large. When the pullback is shallow, B−C is small and V sits right against N or below it, so in shallow corrections you drop V from the candidates.
The E and NT Targets
The third is E. The formula is E = B + (B − A). You add the first advance width A-to-B (B−A) onto the high B. N starts from C, while E starts from B. Adding the same advance width to a higher point makes E the highest target of the four.
E is a large target reached only in a full-fledged trend. One common misconception is worth correcting here: some treat E as the most basic target, but the most frequent target is N. Because E all but ignores the pullback at C and adds the entire first advance width above the high, it is reached only in a full trend where the market pushes hard without pausing. In ordinary markets, take N as the base and treat E as the upper target reached when the trend is strong.
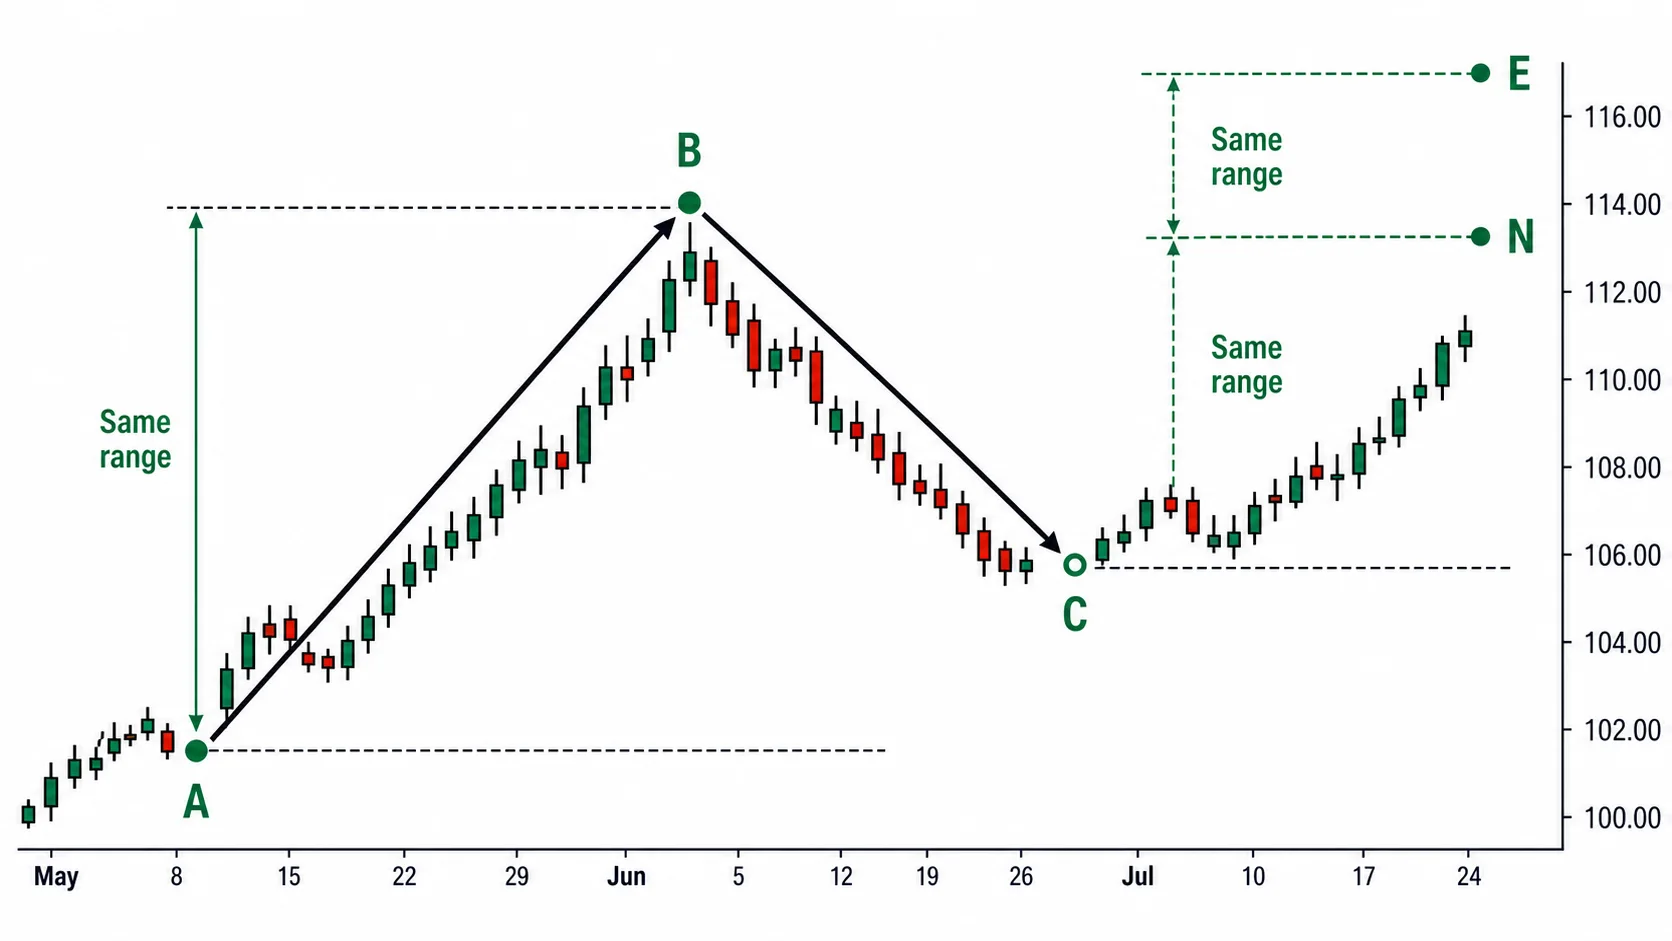
The fourth is NT. The formula is NT = C + (C − A). You add the net advance width between the two lows A and C (C−A) onto the pullback low C. Here (C−A) is not a decline width. It is the net advance from the starting low to the pullback low. Since C is higher than A, you add that difference back onto C.
NT is the lowest and most rarely used of the four targets. (C−A) is usually smaller than the first advance width (B−A), so NT comes out below N and is reached only when the trend is weak and price cannot travel far. In a strong move, price passes NT early, so its usefulness as a target is small.
Set Priority by Pullback Depth
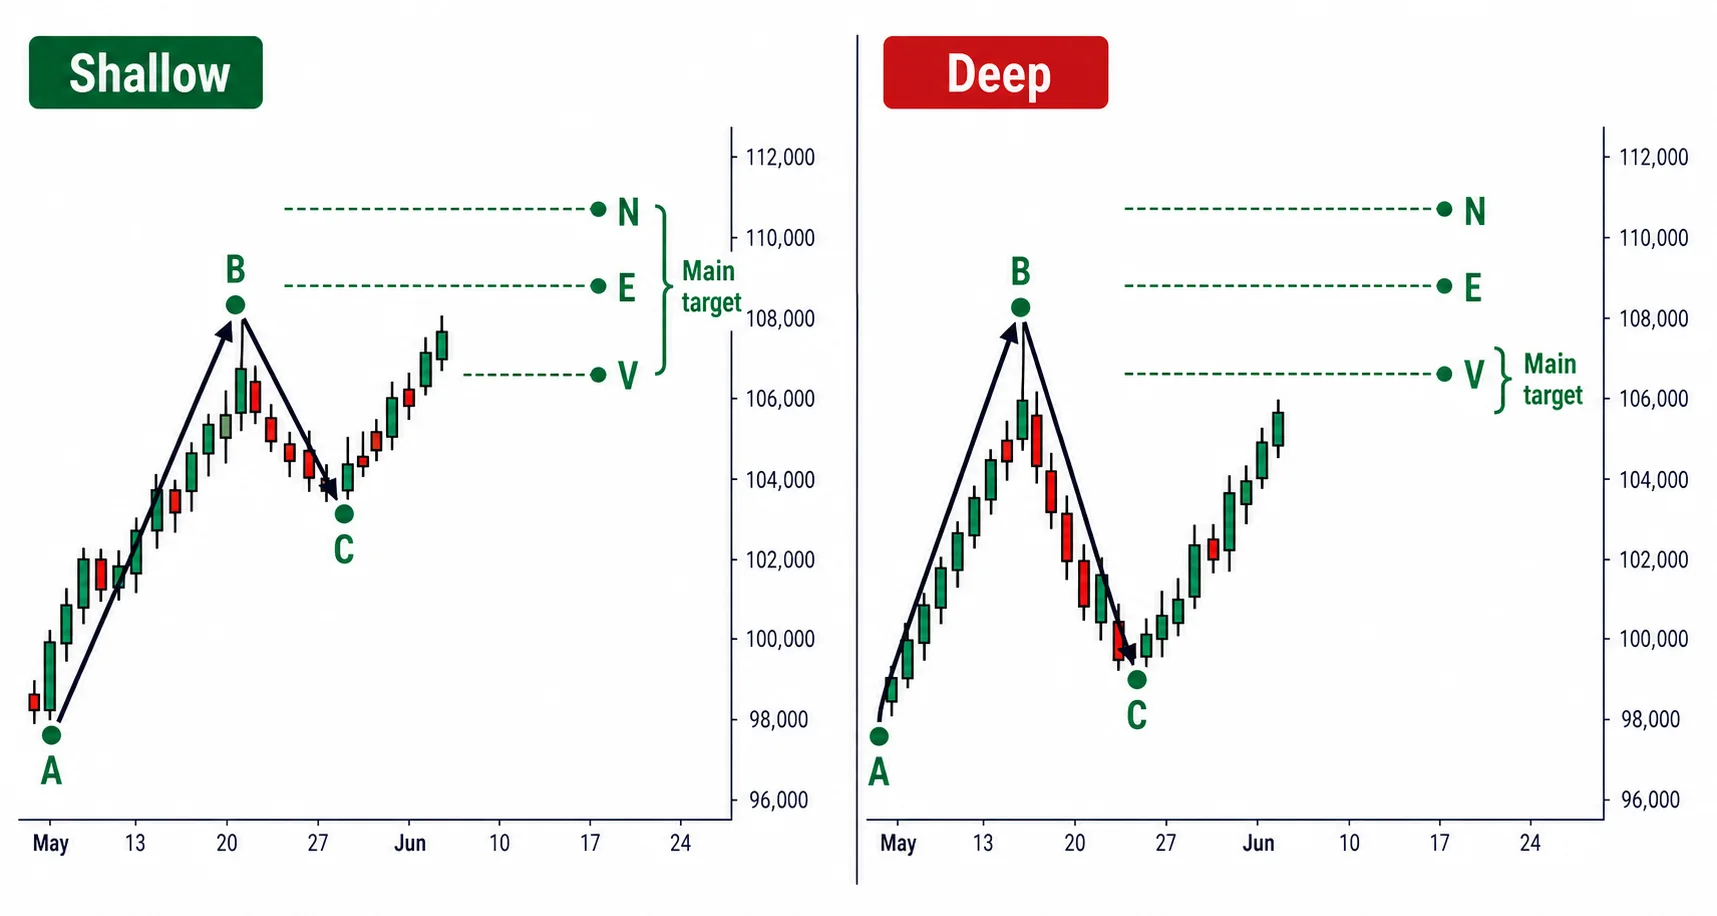
Draw all four values, but decide which one to treat as the main target by the pullback depth (B−C). For the same A, B, and C, the value you weight changes depending on whether the pullback was shallow or deep.
When the pullback is shallow, prioritize N and E. A shallow pullback means the trend is pushing on without resting, so N and E — which use the first advance width directly — fit well, while V sits against N or below it and is not worth tracking separately. When the pullback is deep, make V the main target. The rebound after a deep retracement is wide, so V — which adds the pullback width twice — fits. Even then, keep N and E as candidates and put the greatest weight on V. NT is the lowest target, watched when the trend is weak and price cannot reach the other values, so leave it as the bottom candidate by default and promote it to the main target only when the move is weak.
The Strong Target Is Where Values Overlap
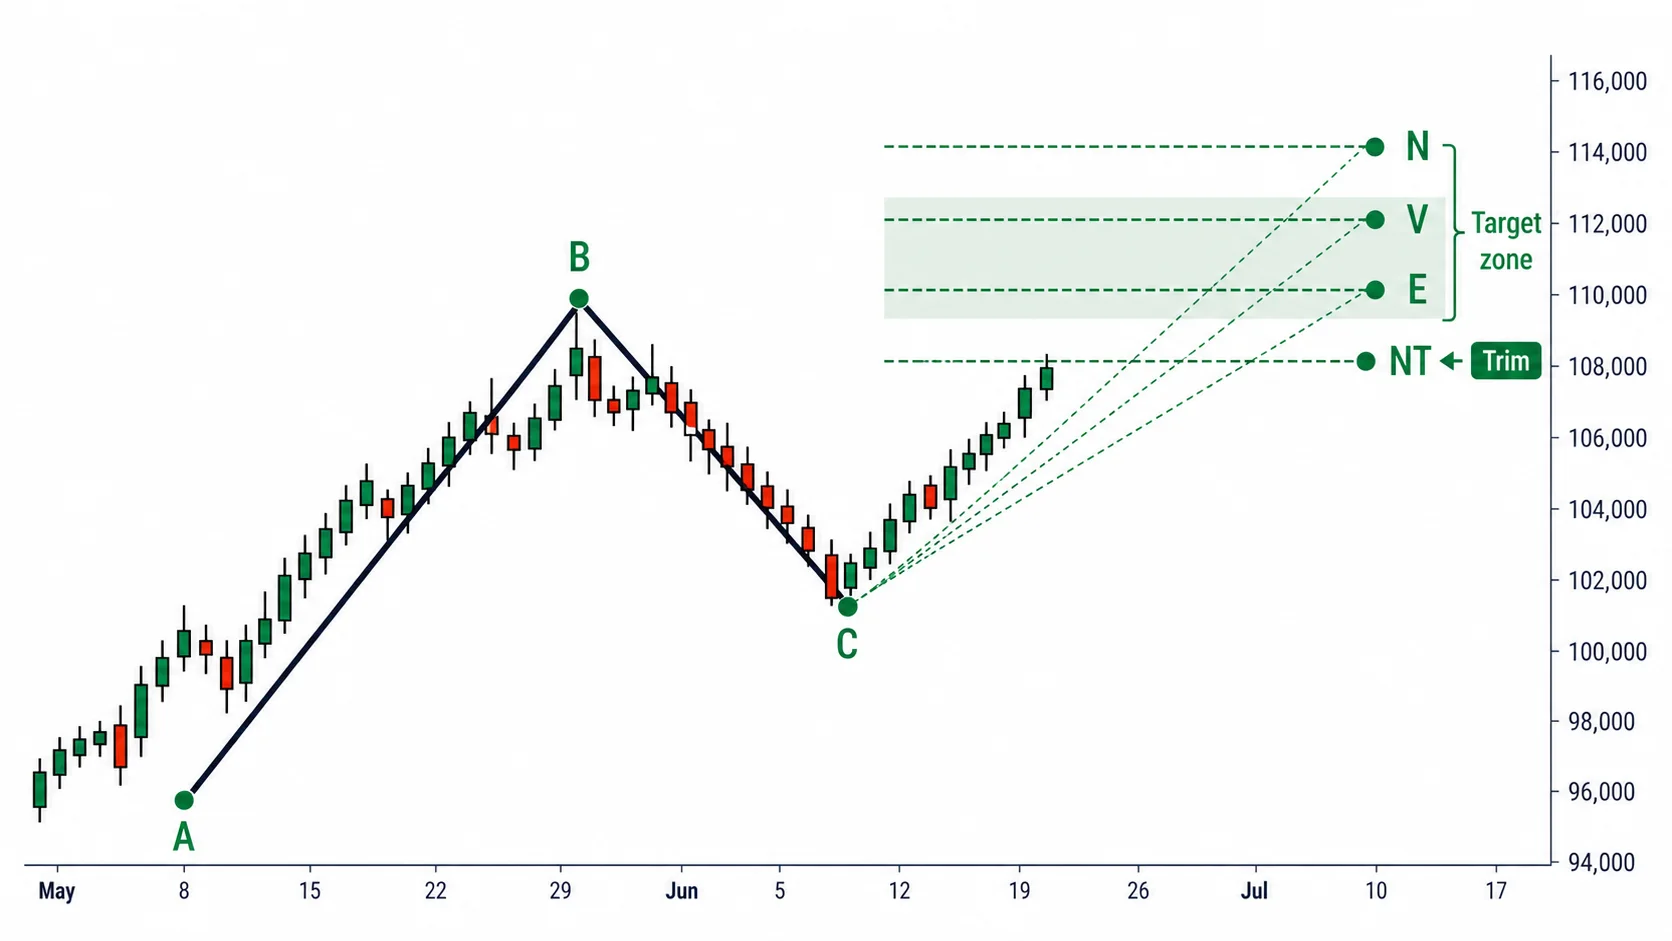
The real value of the four targets emerges when they cluster onto a single price. When targets from different formulas overlap at a similar price, that spot is a strong target (强い目標) pointed to by several pieces of evidence at once. This is called a coincidence of price widths. A single target is only an approximation where price might stop; the weight rests only on a zone where several values overlap.
For instance, when N and V meet at nearly the same price, that price zone becomes a firmer target that both formulas point to simultaneously. Price is more likely to pause once it reaches that spot, so place your first take-profit and position reduction in that zone. Put only a small allocation on a single value, and a larger allocation on a zone where several values overlap.
Price-target theory looks only at price difference; it does not weigh supply-demand or timing. So Hosoda stressed that these targets must always be used together with time theory and wave theory. The three theories each handle a different axis. Price-target theory narrows down the price — how far; time theory narrows down the timing — when; wave theory narrows down whether price has completed a leg. When the price zone the width points to and the change day from time theory line up at the same moment, that spot has price and timing aligning together, and the reliability of a reversal rises a notch. The N completion covered in Part 6 follows the same logic. When price reaching the N target on the width side coincides with the final leg on the wave side exceeding the prior extreme to complete N, all three axes — price, timing, and wave shape — point to one spot, and the move firms up.
When It Misses, Re-Mark A, B, and C
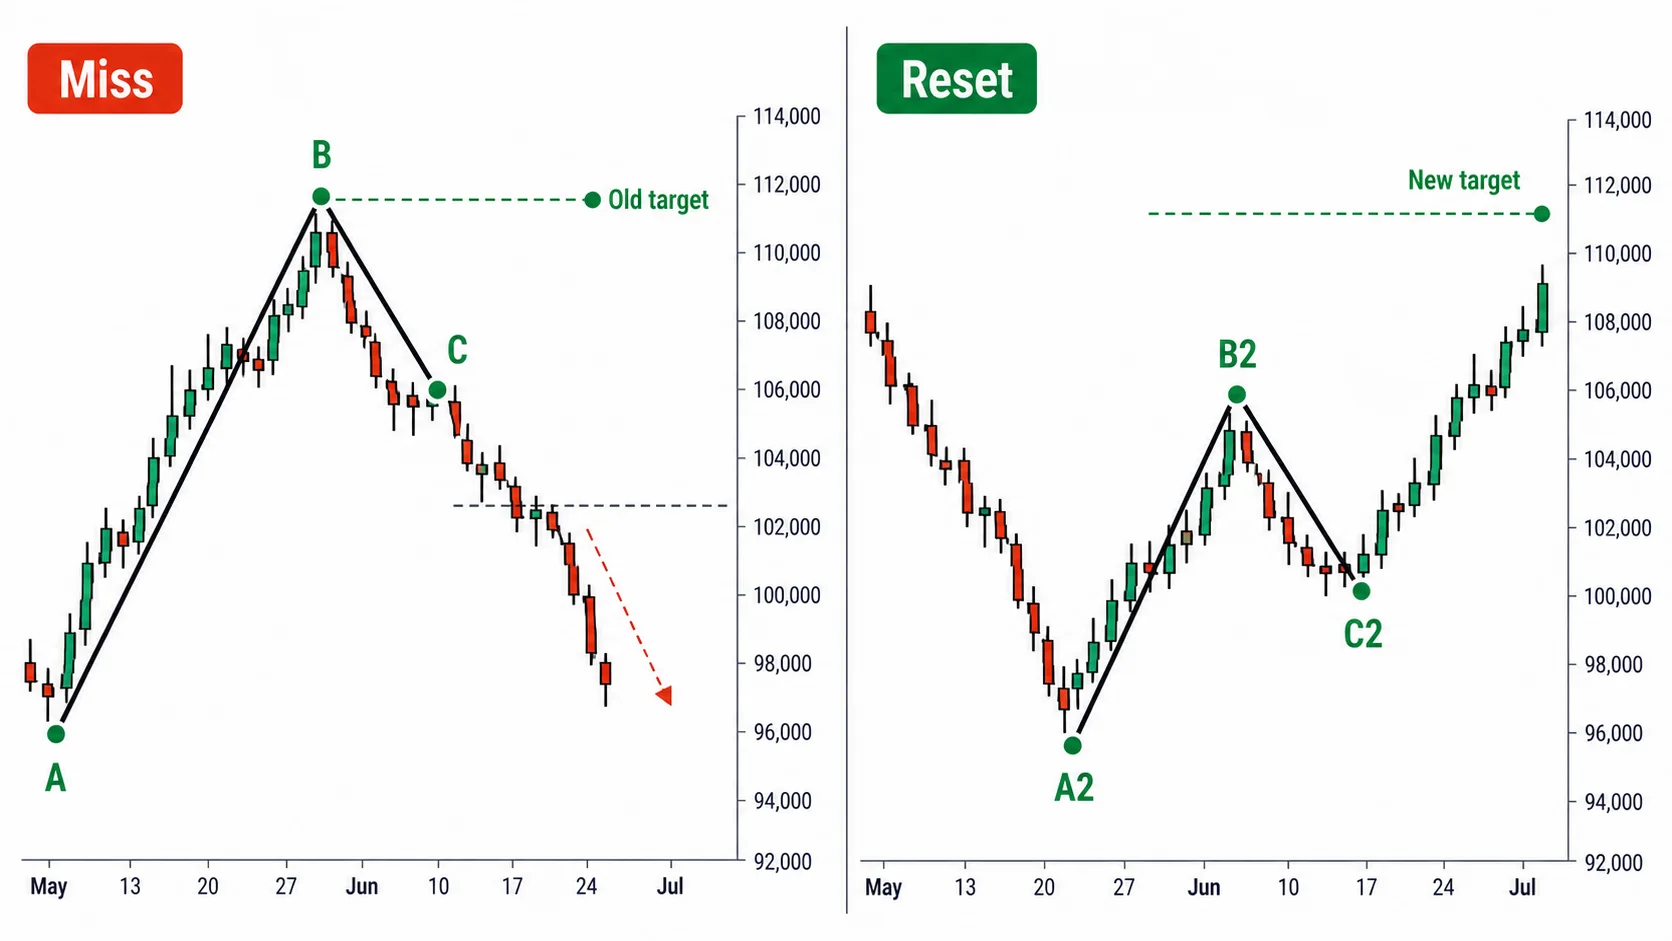
Even with all four values drawn, price sometimes collapses without reaching any target. Here Hosoda's principle is clear. A price target is a prediction (yosoku). It is not a fixed assumption (yosō) set in advance.
An assumption is the mindset of forcing the market to fit a target you have already fixed. A prediction is the attitude of measuring the width in advance but correcting the logic on the spot when it misses. If price has broken down through the target, the premise behind your A-B-C was wrong, so re-label A, B, and C with the newly formed high and low and update the four values. You must not cling to the first target you drew and wait for the market to come back. That is not how price-target theory is used.
In a downtrend, you apply the four formulas inverted top-to-bottom. Take A as the starting high, B as the first low, and C as the rebound high, and switch addition to subtraction to compute downside targets. N subtracts the first decline width (A−B) from C; V subtracts the rebound width (C−B) once more from the low B; E becomes the deep target that subtracts the first decline width (A−B) from the low B; and NT subtracts the net decline width between the two highs A and C (A−C) from C. The more strongly the asset trends, the better these targets fit.