OptiNod Academy
Do Renko charts really filter out noise?
Using daily bars since 2023 for US and Korean stocks, Bitcoin and Ethereum, we checked how much less often Renko bricks change direction than daily candles change color, how far price has already moved by the time the bricks turn, and how trading every turn would have worked out.
Daily candles flip between bullish and bearish all the time, but on a Renko chart, which stacks price up like bricks, the direction of the bricks changed far less often. So would buying and selling when the bricks change direction let you ride trends better?
A Renko chart ignores time and adds one brick each time price moves by a set amount. The name comes from the Japanese word for "brick."
It is often said to strip out small wiggles so the trend looks clean, and TradingView lets you pick it straight from the chart type menu.
The short answer: daily candles flipped between bullish and bearish all the time, while Renko bricks changed direction far less often.[1]
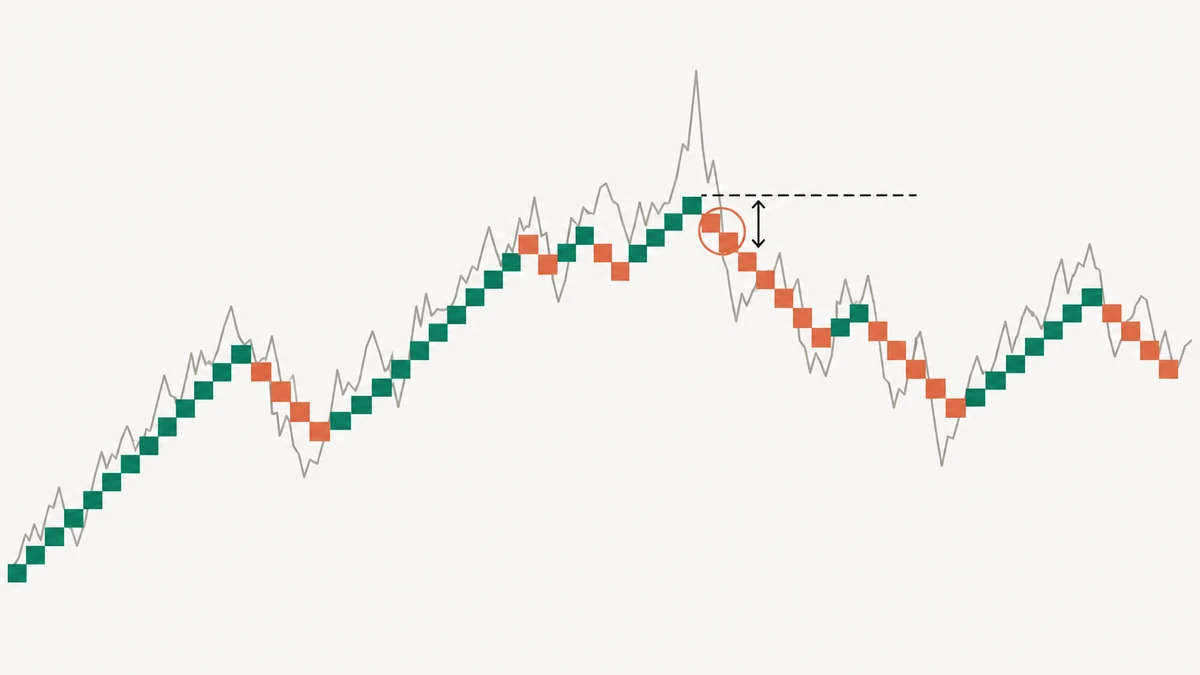
The catch is that the bricks only change direction after price moves two bricks the other way, so by the time they turned up, price was already well off the bottom.[2]
As a result, buying when the bricks turned up and selling when they turned down did worse than simply buying and holding for most of the tickers we looked at.[3]
On top of that, when brick size is set by ATR (Average True Range, the average daily range over the last 14 days), the same period looked very different depending on which day's ATR was used.[4]
We will go through it step by step using daily bars since 2023 for US and Korean stocks and indexes, Bitcoin and Ethereum.

Green bricks were stacked upward and orange bricks downward. Where the color changes, the bricks turned.
Renko adds a brick only when price moves a set amount
On a daily chart, a new candle appears at the end of each day, even on days when price barely moved.
On a Renko chart, a new brick appears only when price moves by the brick size you set.
For example, each brick for Bitcoin in the chart above is $2,036.35. If price moves less than that, the chart stays the same no matter how many days pass.
TradingView offers three ways to set the brick size.
ATR uses the ATR value from the regular chart as the brick size.
Traditional uses a fixed amount you choose, and Percentage uses a percentage of price that you choose.[5]
In this article, we used a single value, the ATR on the last daily bar, as the brick size for the whole period, and built the bricks from daily closes.
The table below shows how large the bricks are for each ticker and how many bricks formed over the same period.[6]
| Item | SPY | BTC | Samsung Electronics |
|---|---|---|---|
| Brick size (relative to last close) | 1.0% | 2.6% | 6.6% |
| Trading days | 961 | 1,398 | 932 |
| Bricks | 144 | 275 | 53 |
For every ticker, there are far fewer bricks than trading days. On most days, no new brick formed.[7]
This article uses the following definitions.
- Tickers: SPY is an ETF (Exchange Traded Fund) that tracks the US S&P 500 index. QQQ is a US Nasdaq large-cap ETF, BTC is Bitcoin, and ETH is Ethereum.
- Brick size: The same fixed amount for the whole period. The % in the table is that amount divided by the last close.
- Brick turn: When bricks that were stacking upward start stacking downward, or the other way around.
- Daily candle color: A candle is bullish if the close is at or above the open and bearish if it is below.
- Bottom and top: The bottom is the lowest close from the time the bricks turned down until they turned back up and we bought. The top is the highest close while we held the position.
- Median: The middle value when all values are lined up from smallest to largest.
On days with big moves, several bricks can form at once. This happened especially often in Bitcoin and Ethereum.[8]
So whether a run of bricks formed in a single day or over several weeks only becomes clear when you pull up the daily chart alongside it.
Bricks changed direction far less often than daily candles changed color
A daily candle is bullish if price rises even slightly during the day and bearish if it falls even slightly. That is why daily candle colors flip so often.
On a Renko chart, a small pullback is not enough to make the bricks turn.
The table below compares, over the same period, the number of days the daily candle changed color with the number of times the Renko bricks changed direction.
| Item | SPY | BTC |
|---|---|---|
| Days the daily candle changed color | 482 | 732 |
| Times the Renko bricks changed direction | 31 | 65 |
Going by this table alone, Renko does filter out small wiggles.
Brick colors stay the same for long stretches, so the bigger picture is easy to see at a glance.
For someone who trades with the trend, it is easier to read than daily candles.
By the time the bricks turned, price had already moved a long way
While bricks are stacking upward, price only needs to rise one more brick to add another.
To turn down, it has to fall past the bottom edge of the last brick and then one more brick below that.
Measured from the top edge of the last brick, price has to drop two full bricks before the bricks turn.[9]
The same applies when falling bricks turn up.
Any pullback smaller than two bricks never shows up on the chart.
Even while green bricks keep stacking up, price may have dropped nearly two bricks and climbed back in between.
When the bricks turn, actual price has already moved two bricks the other way.[10]
If you bought at the open the day after the bricks turned up, how far above the bottom would you have paid?
If you sold at the open the day after they turned down, how far below the top would you have sold?
For each trade, we measured how much more we paid than the bottom close and how much less we got than the top close. The table below shows the median of each.
| Item | SPY | BTC |
|---|---|---|
| How much above the bottom close we bought | +4.3% | +8.9% |
| How much below the top close we sold | −3.3% | −7.9% |
With its larger bricks, Bitcoin was bought after a bigger rise from the bottom than SPY, and sold after a bigger drop from the top.
Looking also at QQQ, Nvidia and Ethereum, which are not in the table, we generally bought further off the bottom in tickers with larger bricks.[11]
Larger bricks filter out more of the small wiggles, but they also push back where you buy and sell.
The chart below shows one SPY trade with a buy and a sell close to the numbers in the table above.[12]

The vertical lines show the gap between them.
If you wait for the bricks to turn before buying or selling, you miss the rise off the bottom and give back the drop from the top.
Trading every brick turn did worse than buy-and-hold in most cases
Because bricks rarely turn, there are also few trades.[13]
So how did returns look if you bought and sold whenever the bricks turned?
We bought when the bricks turned up and sold when they turned down. Every buy and sell was at the open on the trading day after the bricks turned.
Short selling and fees were not included.
The numbers in the table below are cumulative returns over the same period.[14]
| Approach | SPY | QQQ | BTC | ETH |
|---|---|---|---|---|
| Buy and hold | +97% | +157% | +365% | +86% |
| Buy and sell on brick turns | +66% | +55% | +58% | +107% |
In the table, Ethereum is the only ticker where trading the turns earned more.
In Bitcoin and Ethereum, fewer than half of the trades were winners.[15]
Nvidia, which is not in the table, showed an even bigger gap. Holding would have produced a large gain, while trading the brick turns would have lost money.[16]
KOSPI and Samsung Electronics had too few trades to measure accurately.
Brick turns on their own fell short as a trading signal.
Once fees are paid, the returns from trading the turns shrink further.
ATR-based bricks change with whichever day's ATR you use
ATR changes every day. So when brick size is set by ATR, the same stretch of history is drawn differently depending on which day's ATR is used.
TradingView's official documentation does not say which bar's ATR it uses.
Indicator authors explain that because the latest ATR value is applied to the entire history, a chart may look different when you open it again later.[17]
To see how much it changes, we drew the same period of daily bars twice, once with the ATR from a year ago and once with the current ATR.
The numbers in the table below are how many bricks formed over the same period with each ATR.[18]
| ATR used as brick size | KOSPI | BTC |
|---|---|---|
| ATR from a year ago | 439 | 103 |
| Current ATR | 64 | 275 |
KOSPI's ATR rose sharply over the year, so drawing with the current ATR gives far fewer bricks. Bitcoin's ATR went the other way and shrank, so it has more bricks.[19]
Nvidia, whose ATR was almost the same as a year earlier, also had a similar number of bricks.[20]
The number of brick turns also changed a lot.[21]
Many of the turns on the KOSPI chart drawn with the ATR from a year ago do not appear on the chart drawn with the current ATR.

The small bricks on the left turn often, and the large bricks on the right turn rarely.
Traditional uses a fixed value you choose, so the brick size does not depend on the date.
To compare an old chart and today's chart with the same bricks, set the size with Traditional.
Easy-to-miss points on a Renko chart
The top and bottom edges of each brick are calculated by adding or subtracting the brick size from the previous brick's edge, so they can differ from prices that actually traded.
Comparing the price where the bricks turned with the actual open the next day showed a gap even in SPY, and a much wider one in KOSPI.[22]
The bricks in this article were built from daily closes.
TradingView can build bricks from shorter timeframes, so even on the same ticker, the bricks may look different from the charts in this article.
Kagi, Line Break and Point and Figure charts are also drawn from price movement instead of time. We did not test them in this article.
Heikin Ashi is another chart that smooths out small wiggles, and the prices it plots also differ from actual traded prices.
Whatever chart you use to read the trend, set your stop and target from actual prices on a regular chart.
What to check when using Renko
- Brick size: Did you set a fixed value? If you use ATR, which day's value is it?
- Distance from the bottom: Before buying where the bricks turned up, did you check how far price had already come off the bottom?
- Actual prices: Did you set your stop and target from actual prices on a regular chart?
- Return comparison: Did you compare trading the brick turns with simply holding over the same period?
Based on these results, Renko is best used as a view of the bigger picture, with the brick size fixed in advance.
- [1] Since 2023, SPY (a US S&P 500 ETF) daily candles switched between bullish and bearish 482 times, while Renko bricks (brick size = ATR) changed direction 31 times.
- [2] Buying at the open the day after the Renko bricks turned up meant paying a median of 4.3% above the prior bottom close for SPY and 8.9% for BTC.
- [3] Trading this way returned +66% for SPY versus +97% for holding, and +58% versus +365% for BTC. Of the seven tickers, only Ethereum did better by trading. Fills are at the next day's open, and fees are not included.
- [4] For KOSPI over the same period since 2023, using the ATR from a year ago (October 31, 2025) gives 439 bricks, while using the current ATR (October 30, 2026) gives 64.
- [5] The default period for the ATR method is 14. Each method is explained in TradingView's guide to Renko charts.
- [6] The period runs from January 3, 2023 to the last bar. The last bar is October 30, 2026 for SPY and Samsung Electronics, and October 31, 2026 UTC for BTC.
- [7] Bricks formed on 128 days for SPY, 209 days for BTC and 43 days for Samsung Electronics.
- [8] Two or more bricks formed in a single day on 48 days for BTC and 83 days for ETH.
- [9] To use the example from TradingView's guide: with a brick size of 2 and a last brick spanning $52–54, the next brick forms when the close is $56 or higher, or $50 or lower. Source: TradingView's guide to Renko charts.
- [10] Two bricks equal 2.0% of the last close for SPY and 5.2% for BTC.
- [11] The median amount paid above the bottom close was +7.0% for QQQ, +13.9% for NVDA and +10.7% for ETH. Brick sizes relative to the last close were 1.8% for QQQ, 3.0% for NVDA and 3.9% for ETH.
- [12] The bottom close was $517.38 on August 5, 2024, and the buy price was the August 14 open of $542.85, +4.9%. The top close was $563.68 on August 30, and the sell price was the September 9 open of $544.65, −3.4%.
- [13] Completed trades: 14 for SPY and 32 for BTC.
- [14] The period runs from January 3, 2023 to the last bar. The last bar is October 30, 2026 for SPY and QQQ, and October 31, 2026 UTC for BTC and ETH. An SPY trade still open at the last bar was valued at the last close.
- [15] Among completed trades, the share of winners was 57% for SPY, 55% for QQQ, 38% for BTC and 42% for ETH.
- [16] For NVDA, trading the brick turns returned −33%, while holding returned +1,278%.
- [17] This is described in LuxAlgo's explanation of Renko and in the Renko descriptions collected in TradingView's public scripts.
- [18] The ATR from a year ago is the value on October 31, 2025. The current ATR is the value on October 30, 2026 for KOSPI and October 31, 2026 UTC for BTC.
- [19] KOSPI's ATR went from 71.66 to 260.88, and BTC's ATR went from 3,826.34 to 2,036.35.
- [20] NVDA's ATR went from 6.19 to 6.22, and its brick count went from 120 to 114.
- [21] Switching from the ATR of a year ago to the current ATR changes the number of brick direction changes from 69 to 13 for KOSPI and from 31 to 65 for BTC.
- [22] The median gap, up or down, between the price where the bricks turned and the next day's open was 0.53% for SPY and 3.57% for KOSPI.