OptiNod Academy
Does Heikin Ashi help you stay in a trend longer?
Using daily bars for US and Korean stocks (since 2016) and Bitcoin and Ethereum (since August 2017), we checked how much less often Heikin Ashi changes color than regular candles, how far price has already moved when the color flips, and how trading every color change would have worked out.
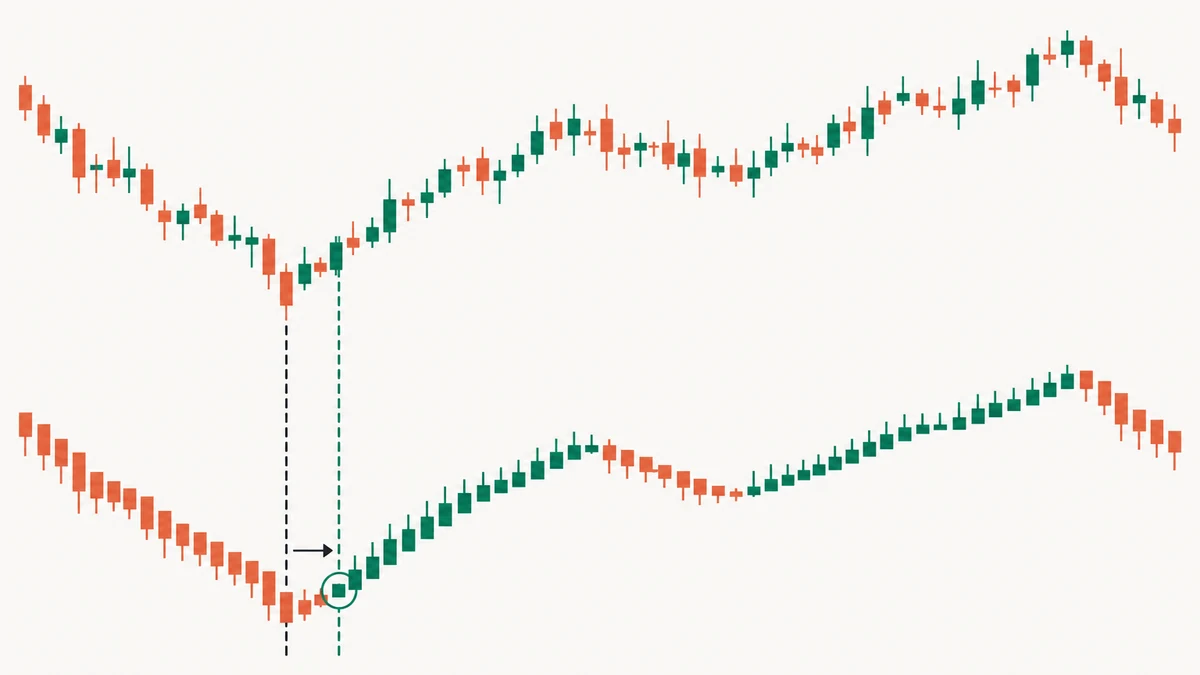
Heikin Ashi changed color on about half as many days as regular candles. So does it help you stay in a trend longer?
Heikin Ashi redraws candles by averaging the open, high, low and close. The name is Japanese for "average bar."
It is widely used and often said to show the trend more cleanly because its color rarely flips, and TradingView lets you pick it straight from the chart type menu. How it is calculated is covered separately in Candlestick Patterns Part 8.
The short answer: Heikin Ashi really did change color less often, and the same color lasted longer.[1]
The catch is that the color flips late, so by the time it turned green, price was already well off the bottom.[2]
Holding only while the candles were green and selling when they turned red generally did better than doing the same with regular candles. In stocks, though, it fell far short of simply buying and holding.[3]
A green candle with no lower wick is often said to signal a strong rally, but in the US indexes, the share that were higher a week later was almost the same as for green candles with a lower wick.[4]
We will go through it step by step using daily bars for US and Korean stocks and indexes (since 2016) and Bitcoin and Ethereum (since August 2017).

Heikin Ashi changed color on about half as many days as regular candles
A regular candle is green if the close is at or above the open, and red if it is below.
Heikin Ashi sets its color the same way, but with a recalculated open and close.
The close is the average of that day's open, high, low and close, and the open is the average of the previous Heikin Ashi open and close.
Because the previous day's values feed into today's open, the color does not flip easily even when price briefly moves the other way.
The chart above shows the same period of SPY, an ETF (Exchange Traded Fund) that tracks the US S&P 500 index, drawn two ways.
The regular candles on the left alternate between green and red, while the Heikin Ashi candles on the right stay the same color for long stretches.
Over the whole period since 2016, Heikin Ashi also changed color on about half as many days as regular candles.[5]
The same was true for KOSPI, Samsung Electronics, Bitcoin and Ethereum.[6]
Runs of the same color also lasted longer.
In SPY, the average run of one color was almost twice as long on Heikin Ashi as on regular candles.[7]
Even in the stretch where green continues on the right side of the chart, red candles keep showing up in the regular candles on the left.
Each Heikin Ashi color blends several days of prices, so to see how the market actually closed that day, you have to look at regular candles.
Because the color flips late, it missed the bottom and the top
If the color rarely changes, that also means it changes late.
The reason is the same as why a moving average crossover lags.
An average includes past prices, so it does not immediately reflect the latest move.
So how late was it in actual prices?
We bought at the open the day after the candles turned green and sold at the open the day after they turned red, then checked how far those prices were from the bottom and the top.
The numbers in the table below are, for each green run, the median rise from the bottom to the buy price and the median drop from the top to the sell price.
| Comparison | SPY | Bitcoin | Ethereum |
|---|---|---|---|
| Bottom to buy price | +1.6% | +5.2% | +7.0% |
| Top to sell price | -1.1% | -4.7% | -5.8% |
- Bottom: The lowest price from the start of the preceding red run to the day the candles turned green.
- Top: The highest price from the day the candles turned green to the day they turned red.
- Buy and sell price: The actual open on the trading day after the color changed.

The vertical lines show the gap between them.
In the chart, Bitcoin only turned green a few days after the bottom.
By the next day's open, price was already well off the bottom, and when it was time to sell, the open was also well below the top.[8]
Bitcoin and Ethereum are more volatile than SPY, so these gaps were larger too.
If you buy when the candles turn green and put your stop below the bottom, your stop ends up that much farther away, because price has already climbed off the bottom.
Holding only through green runs beat regular candles but trailed buy-and-hold in stocks
Fewer color changes also mean fewer trades. So how did returns look?
As before, we bought at the open the day after the candles turned green and sold at the open the day after they turned red.
We held nothing while the candles were red and did not short.
We ran the same rules on regular candles, and compared both with buying at the start and holding to the end.[9]
The numbers in the table below are cumulative returns over the whole period, without fees.
| Approach | SPY | QQQ | KOSPI | Bitcoin | Ethereum |
|---|---|---|---|---|---|
| Buy and hold | +277% | +531% | +193% | +1,721% | +649% |
| Trade on regular candles | +60% | +10% | +39% | +124% | +44% |
| Trade on Heikin Ashi | +83% | +80% | +113% | +2,961% | +784% |
In SPY, QQQ and KOSPI, trading on Heikin Ashi beat trading on regular candles.
But it fell far short of buy-and-hold, and the gap was even wider in stocks that rose sharply, such as Nvidia.[10]
In Samsung Electronics, trading on Heikin Ashi even did worse than trading on regular candles.[11]
Trading on Heikin Ashi means holding nothing while the candles are red, so you are in the market for only a little over half the period.[12]
Any gains during the rest of the period do not count toward your return.
In Bitcoin and Ethereum, trading on Heikin Ashi beat holding.
Even so, fewer than four in ten trades were winners for both coins.[13]
The winning trades were large enough that the strategy made money overall, despite more losing trades.
It beat holding because both coins fell overall during the stretches when the strategy was out of the market.[14]
The number of trades also differed. In SPY, trading on Heikin Ashi produced about half as many trades as regular candles.[15]
So once fees are included, Heikin Ashi pulls even further ahead of regular candles.
With just 0.1% per round trip, trading SPY on regular candles lost money, while trading on Heikin Ashi still made money.[16]
Bitcoin still beat holding after fees, but Ethereum fell short once fees were included.[17]
Maximum drawdown is the largest percentage drop from a previous peak.
For Bitcoin and Ethereum, trading on Heikin Ashi had a smaller maximum drawdown than holding.[18]
Stocks and indexes varied: SPY's drawdown got smaller, but KOSPI's and Samsung Electronics' actually got larger.[19]
In the end, in stocks, trading every color change returned less than buying and holding.
Green candles with no lower wick did not lead to bigger gains the next week in US indexes
Many explanations say that a green Heikin Ashi candle with no lower wick signals a strong uptrend.
No lower wick means the Heikin Ashi low is the same as its open.
After this shape appeared, did actual prices really rise more often?
We split green candles into those with and without a lower wick and compared them.
The numbers in the table below are the share of cases where the close 5 trading days later was higher than the regular candle's close on the day of the green candle.
| Green candle | SPY | QQQ |
|---|---|---|
| No lower wick | 61.0% | 59.8% |
| With lower wick | 59.5% | 60.4% |

The line from the hollow dot to the filled dot is the change in close over those 5 trading days.
In SPY and QQQ, the share that rose was almost the same with or without a lower wick.
In fact, in both ETFs, green candles without a lower wick outnumbered those with one.[20]
The Heikin Ashi open is an average, so during a rise it sits below the actual price.
If the day's actual low does not come down that far, the candle is drawn with no lower wick.
That is why green candles with no lower wick are a common shape during rising stretches.
As the chart shows, even after several days of these green candles, price was sometimes higher and sometimes lower 5 trading days later.[21]
In KOSPI, Nvidia, Bitcoin and Ethereum, green candles with no lower wick rose slightly more often and had higher average returns.[22]
In Samsung Electronics, the share that rose was almost the same.[23]
In the end, in the US indexes, the lack of a lower wick gave no reason to add to a position.
It is easy to mistake Heikin Ashi prices for real prices
The Heikin Ashi close is the average of the day's four prices, so it differs from the actual close on a regular candle.
The bigger the day's move, the bigger the gap between that average and the close.
In SPY the gap was small, but in Bitcoin it was larger, and on some days it got very wide.[24]
Renko, which also smooths out small moves, shows prices on screen that differ from actual prices.
Renko draws a new brick-shaped bar only when price moves by a set amount, so any movement in between does not show up on the screen.
The problem comes when you set a stop or target price on these charts.
Support and resistance lines drawn at averaged values or brick prices end up in different places from actual prices.
Orders are filled at actual prices, so stops and targets should be set on regular candles.
What to check when using Heikin Ashi
There are four things to check when you plan a trade with Heikin Ashi.
- Actual prices: Did you set your stop and target from actual prices on regular candles? Heikin Ashi prices are calculated averages.
- Rise before buying: If you are about to buy because the candles turned green, how far has price already come off the bottom? By the time the color flips, actual price has already moved.
- Comparison with holding: Did you compare trading on color changes with simply holding over the same period? Stocks did worse than holding, while Bitcoin actually did better.
- Timeframe: If you trade on intraday bars, did you run a separate comparison on that timeframe? All the numbers in this article come from daily bars.
In the end, Heikin Ashi did let you stay in a trend longer than regular candles.
But stocks kept rising overall even during the red stretches, so it could not beat buying and holding.
Use Heikin Ashi to see whether a trend is still going, and set entry and stop prices on regular candles.
- [1] In SPY (a US S&P 500 ETF), the share of days whose color differed from the previous day was 51% for regular candles and 26% for Heikin Ashi, and 53% and 24% for BTC. Among same-color runs, the share that lasted 5 days or more in SPY was 6% for regular candles and 28% for Heikin Ashi.
- [2] Buying at the open the day after the candles turned green meant paying a median of 1.6% for SPY and 5.2% for BTC above the lowest price between the start of the preceding red run and the day the color turned green.
- [3] For SPY over 2016–2026, buying and holding returned +277%, trading on Heikin Ashi +83% and trading on regular candles +60%. For Bitcoin and Ethereum, trading on Heikin Ashi beat holding. Fees are not included.
- [4] The share that were higher 5 trading days later was 61.0% for green candles with no lower wick and 59.5% for those with one in SPY.
- [5] The share of all trading days whose color differed from the previous day was 51% for regular candles and 26% for Heikin Ashi in SPY. It was 51% and 26% for QQQ, and 51% and 25% for Nvidia.
- [6] For regular candles and Heikin Ashi respectively: KOSPI 52% and 26%, Samsung Electronics 50% and 28%, Bitcoin 53% and 24%, Ethereum 53% and 25%.
- [7] In SPY, the average run of one color was 2.0 trading days for regular candles and 3.8 trading days for Heikin Ashi.
- [8] From a low of 65,712.12 on April 2, 2026, the candles turned green on April 5, and the April 6 open of 69,034.18 was 5.1% above the bottom. A high of 73,790.00 came on April 11, and the candles turned red the next day. The April 13 open of 70,741.56 was 4.1% below the top.
- [9] SPY, QQQ and KOSPI cover 2016-01-04 to 2026-10-30, and Bitcoin and Ethereum cover 2017-08-17 to 2026-10-31. QQQ is an ETF that tracks the Nasdaq 100 index. US ETF prices are adjusted for splits, and dividends are not included. Trades still open on the last day were valued at the last close.
- [10] For Nvidia, buying and holding returned +25,250%, and trading on Heikin Ashi +335%.
- [11] Samsung Electronics' cumulative return was +99% trading on regular candles and +14% trading on Heikin Ashi. Fees are not included.
- [12] The share of days in a position when trading on Heikin Ashi was 61% for SPY, 60% for QQQ, 57% for KOSPI, 52% for Samsung Electronics, 53% for Bitcoin and 52% for Ethereum.
- [13] Among completed trades, the share of winners was 37% for Bitcoin and 36% for Ethereum.
- [14] This is the price change across only the stretches from each sell to the next buy, chained together. It was -41% for Bitcoin and -15% for Ethereum, versus +106% for SPY and +38% for KOSPI.
- [15] SPY had 687 trades on regular candles and 358 on Heikin Ashi.
- [16] With a 0.1% round-trip fee, SPY's cumulative return was -19% on regular candles and +28% on Heikin Ashi. Without fees, they were +60% and +83%.
- [17] With a 0.1% round-trip fee, the cumulative return trading on Heikin Ashi was +1,964% for Bitcoin and +483% for Ethereum. Buying and holding returned +1,721% and +649%.
- [18] Maximum drawdown trading on Heikin Ashi versus holding was -69% versus -83% for Bitcoin, and -71% versus -94% for Ethereum.
- [19] Trading on Heikin Ashi versus holding: SPY -27% vs. -34%, QQQ -35% vs. -36%, KOSPI -46% vs. -44%, Samsung Electronics -61% vs. -45%.
- [20] Green candles with and without a lower wick: 1,037 and 630 for SPY, and 1,070 and 570 for QQQ.
- [21] In April 2026, the run lasted from April 8 to April 20, and over the following 5 trading days the close went from 708.72 to 715.17, +0.91%. In January 2025, the run lasted from January 15 to January 24, and the close then went from 607.97 to 601.82, -1.01%.
- [22] The share that were higher 5 trading days later, without and with a lower wick, was 58.3% and 53.6% for KOSPI, 61.2% and 55.2% for Nvidia, 53.0% and 49.9% for Bitcoin, and 53.0% and 48.7% for Ethereum. Average returns were +0.43% and +0.07% for KOSPI, +1.22% and +0.97% for Nvidia, +1.51% and +0.32% for Bitcoin, and +1.55% and +0.74% for Ethereum. For Bitcoin and Ethereum, the 5 days include weekends.
- [23] For Samsung Electronics, the share that were higher 5 trading days later was 49.0% without a lower wick and 49.7% with one.
- [24] The median gap (absolute value) between the Heikin Ashi close and the actual close was 0.20% for SPY and 0.75% for Bitcoin. On the 10% of days with the largest gaps in Bitcoin, it was 2.61% or more.