OptiNod Academy
Is it too late to buy at a new high?
Using roughly 30 years of daily bars for the S&P 500, Nasdaq 100 and KOSPI, we compared what happened 6 months after buying on a new-high day versus buying on any trading day. We also checked individual stocks and Bitcoin.
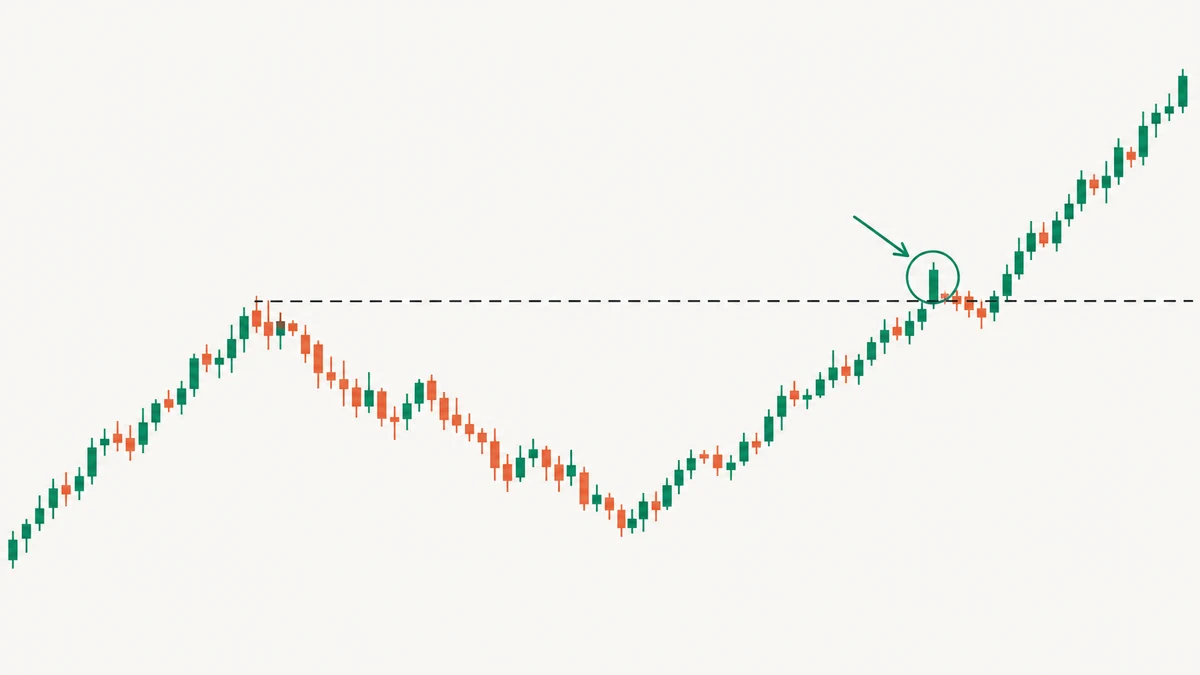
If you had bought an index on a new-high day, it was actually more likely to be higher 6 months later. Is buying at a new high really too late?
A 52-week high is a day when price rises above its highest level of the past year.
When you see a stock at a new high, the first thought is often, "Hasn't it already gone up too much?" So many people prefer to wait a bit and buy on a pullback.
In 2026, major indexes around the world hit one all-time high after another.
The US S&P 500 kept setting new all-time highs throughout the year,[1] and Japan's Nikkei 225 and KOSPI also broke above their all-time highs in June.
After that, though, the Nikkei 225 and KOSPI fell sharply.[2]
For anyone who bought near the peak, the new high turned out to be the most expensive price.
The short answer: in the indexes, buying on a new-high day did no worse than buying on any trading day.
Price was more often higher 6 months later, and less often fell more than 10% along the way.[3]
Individual stocks, however, varied from ticker to ticker. And even the indexes often fell back below the old high within a month after closing above it.[4]
We will start with roughly 30 years of daily bars for SPY (an S&P 500 ETF), QQQ (a Nasdaq 100 ETF) and KOSPI, then look at individual stocks and Bitcoin as well.

New highs come in clusters
After a new high, in most cases an even higher new high followed.
In all three indexes, more than nine times out of ten, price traded above the new-high day's high again within 30 days.[5]
New-high days were not rare either. For SPY, about one trading day in eight was a new-high day.[6]
While prices were rising, new highs came in clusters, and it was rare for a new-high day to be the top itself.
In the indexes, buying on a new-high day held up fine 6 months later
We compared buying at the close on new-high days with buying at the close on any trading day, using the close 6 months later.
The numbers in the table below are the share of cases where the close 6 months later was above the purchase price.
| Day bought | SPY | QQQ | KOSPI |
|---|---|---|---|
| New-high day | 77.2% | 80.6% | 65.1% |
| Any trading day | 74.2% | 72.1% | 56.5% |
- New-high day: A day when the intraday high rose above the highest price of the previous 365 days. Days that broke above only intraday and closed back below are included.
- Any trading day: Every trading day after a full year of price history has built up. New-high days are included.
- 6 months later: The close on the first trading day after 182 days have passed since the purchase. All day counts in this article are calendar days.
- Share: 6-month windows overlap for nearby days, so this is not the same as the win rate of independent trades.
- Days 10–20% below the high: Days when the close was more than 10% and no more than 20% below the 52-week high up to that day.
- Data: SPY and QQQ are exchange-traded funds (ETFs) that track the S&P 500 and Nasdaq 100, and their prices exclude dividends. KOSPI uses daily bars of the index itself.
In all three indexes, the share was higher for new-high days than for any trading day.
The gap was wider in QQQ and KOSPI.
The average 6-month return was similar in SPY and higher on new-high days in KOSPI.[7]
In all three indexes, a new high alone was no reason to hold off on buying.
Big drops within 6 months were more common when buying below the high
Even if price was higher 6 months later, a deep drawdown along the way makes it hard to hold on until the end.
So we checked whether the close ever fell more than 10% below the purchase price within 6 months of buying. Cases that dropped that far were counted even if they recovered later.
The numbers in the table below are the share of cases that went through such a drop.
| Day bought | SPY | QQQ | KOSPI |
|---|---|---|---|
| New-high day | 15.5% | 25.4% | 34.7% |
| Day 10–20% below the high | 48.6% | 33.7% | 50.8% |
| Any trading day | 24.0% | 32.6% | 42.1% |
In all three indexes, new-high days had the lowest share, and days 10–20% below the high had the highest.

Even after price dropped into the shaded zone, there were times it kept falling.
New-high days and days 10–20% below the high already differed in how much price moved each day beforehand.
Standard deviation measures how widely daily returns are spread around their average. The larger it is, the more price swung up and down from day to day.
In SPY, the standard deviation over the previous 20 trading days was smallest on new-high days and largest on days 10–20% below the high.[8]
On new-high days the index was quieter than usual, while the days that looked cheap were days when price was already swinging hard day to day.
Even new highs after several years had very different outcomes
A day that breaks a high that held for several years is the most eye-catching kind of new high on a chart.
In May 2017, KOSPI broke above its 2011 high.
If you had bought that day, the close never fell below your purchase price over the following year, and a year later you would have been up 9.8%.[9]
In October 2007, SPY broke above its 2000 high.[10]
If you had bought that day, you would have been down 32.8% a year later.
SPY did not break above its 2007 high again until April 2013, and buying then would have left you up 15.4% a year later.[11]

KOSPI did not close below the purchase price over the following year, while SPY fell sharply.
Even though both were new highs after several years, the year that followed went in opposite directions.
Individual stocks varied from ticker to ticker
To see whether the index results also hold for individual stocks, we ran the same comparison on US and Korean stocks and Bitcoin from 2017 onward.
To match the period, we also re-ran SPY and QQQ from 2017. Bitcoin uses Binance spot daily bars (in UTC), and we compared purchase days from 2018 onward.
The numbers in the table below are the share of cases where the close 6 months later was above the purchase price.
| Asset | New-high day | Any trading day |
|---|---|---|
| SPY | 73.8% | 78.5% |
| QQQ | 86.4% | 81.1% |
| Apple | 74.5% | 77.5% |
| Nvidia | 82.1% | 81.0% |
| Tesla | 54.6% | 57.3% |
| Samsung Electronics | 62.6% | 59.1% |
| SK Hynix | 68.6% | 68.3% |
| Bitcoin | 60.9% | 62.5% |
Every asset in the table rose sharply over this period, and no delisted stocks are included.
New-high days came out higher for four assets and lower for the other four, and none of the gaps were large.[12]
For this period alone, SPY was also lower on new-high days.
The share that fell more than 10% within 6 months was lower on new-high days for 6 of the 8 assets.
Apple and Tesla went the other way. For Apple, about half of the purchases made on new-high days fell more than 10%.[13]
The pattern of quiet new highs seen in the indexes did not hold for some assets.
For Tesla, Samsung Electronics, SK Hynix and Bitcoin, daily moves over the 20 trading days before a new-high day were actually larger than on any trading day.[14]
Because results differed from ticker to ticker, what we saw in the indexes cannot be applied as is to individual stocks.
Even after closing above the old high, most cases closed back below it within 30 days
The new-high days above include days that broke the old high only intraday.
Here we looked only at days that closed above the old high, and checked the closes over the following 30 days.
| 30 days after closing above the old high | SPY | QQQ | KOSPI |
|---|---|---|---|
| Share that closed below the old high | 65.7% | 77.8% | 71.0% |
| Share that closed more than 2% below the old high | 31.4% | 38.9% | 41.9% |
| Lowest close (median) | −1.2% | −1.7% | −1.3% |
- Old high: The 52-week high just before the new high.
- Day that closed above the old high: A day that set a new high after no new highs in the previous 30 days, and also closed above the old high.
- Lowest close: The lowest of the next 30 closes, compared with the close on the new-high day.
In all three indexes, more than half of the cases closed back below the old high within 30 days.
Even so, the pullback was usually small. In all three indexes, fewer than half of the cases closed more than 2% below the old high.
For example, SPY closed above its old high on May 15, 2024, but two weeks later it closed back below it.
Even so, buying that day would have left you up 12.7% 6 months later.

The green dot marks May 15, when the close first broke above that price, and the orange dot marks May 30, when it closed back below it.
A stop placed just below the old high is easily hit by a small pullback like this.
The table only looks at closes. Intraday prices can fall further than the close, so in SPY, even a stop placed 2% below the old high was hit in at least 31.4% of cases.
What to check at a new high
When you are weighing whether to buy at a new high, there are four things to check.
- Asset: Is the new high you are looking at in an index or an individual stock? For individual stocks, results from buying on new-high days varied from ticker to ticker.
- Daily moves: Were daily moves over the 20 trading days before the new high smaller than usual? On index new-high days, the market was quieter than usual.
- Drawdown while holding: Could you keep holding if price fell more than 10% within 6 months? Even when SPY was bought on a new-high day, 15.5% of cases fell that far.
- Stop placement: Is your stop just below the old high? Even after closing above the old high, 65.7% of SPY cases closed back below it within 30 days.
Pitfalls
- Intraday high vs. close: New-high days in this article are based on the intraday high. In the SPY table above, 65.7% of days that closed above the old high closed back below it within 30 days. Including days that broke above only intraday, it was 76.9%.
- Stock splits: On a chart that does not adjust for splits, the pre-split price stays as the 52-week high for a full year. During that time, even a real new high does not show up as one on the chart. The US stock and ETF data in this article are split-adjusted.
- Short price history: A stock listed less than a year ago has no record to check a 52-week high against. Such stocks are not in this article's sample either.
- Recent new highs: New-high days from May 2026 onward do not yet have a close 6 months later, so they are left out of the tables. This includes the all-time highs from June onward mentioned at the start.
A new high only tells you that price has passed its record for the past year.
In the indexes, buying on a new-high day was not too late. What someone buying at a new high needs to decide is where to place the stop, and whether to keep holding if price falls more than 10%.
- [1] In 2026, the S&P 500 set 28 all-time closing highs, the last on October 6.
- [2] On November 6, the close was 20.6% below the closing high for the Nikkei 225 and 44.5% below for KOSPI.
- [3] Based on SPY (an S&P 500 ETF) since 1993. The share that was higher 6 months later was 77.2% for new-high days and 74.2% for any trading day, and the share that fell more than 10% within 6 months was 15.5% and 24.0%.
- [4] For SPY, 65.7% closed below the old high within 30 days.
- [5] SPY 93.9%, QQQ 93.7%, KOSPI 92.8%.
- [6] 12.7% of SPY trading days from 1994 to 2026.
- [7] For SPY, +4.8% on new-high days and +5.0% on any trading day. For KOSPI, +9.8% and +5.5%.
- [8] The median was 0.61% on new-high days, 0.86% on any trading day and 1.37% on days 10–20% below the high.
- [9] The close of 2,241.24 on May 4, 2017 broke above the high of 2,231.47 from April 27, 2011. Over the following 12 months, even the lowest close was 1.3% above the purchase price.
- [10] The close of 155.85 on October 5, 2007 broke above the high of 155.75 from March 24, 2000.
- [11] The close of 158.67 on April 10, 2013 broke above the high of 157.52 from October 11, 2007.
- [12] The largest gap was 5.3 percentage points.
- [13] 51.5% for new-high days and 35.5% for any trading day.
- [14] For example, Tesla's median standard deviation was 3.36% on new-high days and 3.23% on any trading day.