OptiNod Academy
What happens the day after a volume spike?
Using 10 years of daily bars for large-cap stocks in Korea and the US, plus Bitcoin and Ethereum, we checked how prices moved after days when volume jumped well above normal.
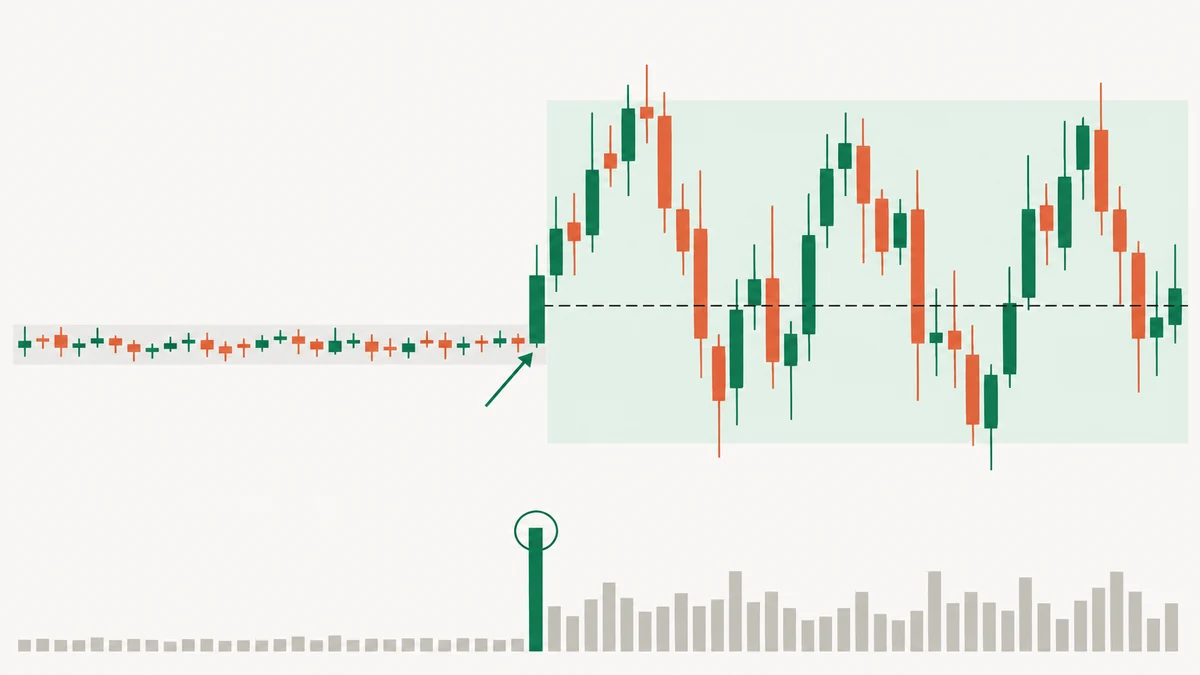
In large-cap stocks, the day after a bullish candle on heavy volume, the price rose less than half the time. So what does volume actually tell you?
A volume spike is a day when trading volume is several times higher than usual. In this article, a volume spike day is any day when volume was more than 3 times the average of the previous 20 trading days.
When a volume bar suddenly shoots up on a chart, it is the first thing that catches your eye. There are plenty of sayings, such as "volume precedes price" and "the low of a big bullish candle on heavy volume becomes support," and it is often read as a sign that big players have stepped in.
The short answer: a volume spike did not decide the next day's direction.
The day after a bullish candle on a volume spike, the price rose less often than usual in the US and about as often as usual in Korea.[1]
That day's low did hold more often than usual, but only because price had risen so much that the low was far away.
For example, Hyundai Motor rallied hard on a volume spike and then did not close below that day's low for almost a month.[2]
Meta, on the other hand, also rallied hard on a volume spike but closed below that day's low within a few days.[3]
We will go through it step by step using 10 years of daily bars for large-cap stocks in Korea and the US, plus Bitcoin and Ethereum.

Hyundai Motor did not close below that low over the next 20 trading days, while Meta closed below it 2 trading days later (orange dot).
Most volume spike days were days with big price moves
Days with volume more than 3 times normal did not come often.[4]
They were even rarer in index ETFs, and most of those were big down days, such as the day after the UK's vote to leave the EU.[5]
Prices also moved more than usual on these days.
On half of the spike days, price rose or fell more than 5% in a single day. For individual stocks, a normal day's move was around 1%.[6]
Because each ticker normally moves by a different amount, we also compared the size of the move with ATR (Average True Range).
ATR is the average daily price range over the last 14 days. "Moved more than 1 ATR" means the close moved away from the previous close by at least the prior ATR.
About three quarters of spike days moved more than 1 ATR.[7]
The next day's direction was a coin flip
If "volume precedes price" were true, the chance of a rise the day after a volume spike should differ from usual.
OBV (On-Balance Volume), which tracks volume cumulatively, is covered in a separate article. This article only compares the close on the day after a spike.
The numbers in the table below are the share of cases where the next trading day's close was higher than that day's close.
| That day's candle | US | Korea | Bitcoin and Ethereum |
|---|---|---|---|
| Bullish on a spike | 43.7% | 46.3% | 46.5% |
| Bullish, typical day | 51.4% | 45.2% | 47.8% |
| Bearish on a spike | 49.4% | 47.8% | 50.0% |
| Bearish, typical day | 53.1% | 49.2% | 54.4% |
This article uses the following definitions.
- Volume multiple: That day's volume divided by the average of the previous 20 trading days. The average does not include that day's volume. In the Korean data, we excluded days right after a stock split changed the volume units, as well as days with zero volume.
- Typical day: Any day in the same market. Spike days are included.
- Bullish and bearish candles: A candle is bullish if the close is above the open and bearish if it is below.
- Quiet day: A day with a volume multiple below 1.5.
- Low held: Every close over the next 20 trading days stayed at or above that day's low. Days that dipped below the low intraday still counted as held if they closed at or above it.
- Bullish or bearish on a spike: A bullish or bearish candle with a volume multiple above 3.
- Sample: The US and Korean stocks are large caps that are still around today, so none were delisted or dropped from their index. Bitcoin and Ethereum use Binance spot daily bars from August 2017, with each day based on UTC (Coordinated Universal Time).
In the US, price rose the next day less often after a bullish candle on a spike than after a typical bullish candle. In Korea it was about the same.
After bearish candles too, in all three markets, price rose the next day less often after a spike than after a typical bearish candle.
Changing the spike threshold gave similar results.
When we lowered the threshold to 2 times the prior average, in both Korea and the US, and when we raised it to 5 times, in Korea, price rose the day after a bullish spike candle less than half the time.[8]
Breakout trading uses 1.5 times volume as a condition, but it also requires a close beyond the range and a retest. A volume multiple on its own, whether 2 times or 5 times, did not decide the next day's direction.
Looking further out did not change the results much either.
The table below shows the average return from the bullish candle's close to the close at the end of each period.
| Market | Period | After a bullish candle on a spike | After a typical bullish candle |
|---|---|---|---|
| Korea | 5 trading days | +0.74% | +0.22% |
| Korea | 20 trading days | +1.91% | +1.08% |
| US | 5 trading days | +0.39% | +0.40% |
| US | 20 trading days | +1.98% | +1.77% |
Even for Korea over 20 trading days, where the two values differed most, the gap was smaller than a normal day's move for Korean stocks (1.17%).
In the end, there was no basis for using the color of a spike day's candle to call the next move.
Comparing days with the same size of rise, the day's low did not hold any better
There is a saying that the low of a bullish candle on heavy volume acts as support.
And the lows of bullish candles on a spike did hold more often than those of typical bullish candles.
In both Korea and the US, about half of bullish candles on a spike never closed below that day's low over the next 20 trading days. For typical bullish candles, it was about one in three.[9]
But as we saw above, many spike days were also days with big price moves. The bigger the day's rise, the farther the low sits from the close.
So what happens if we only compare days when the close rose 1–2 times or 2–3 times the prior ATR?
The numbers in the table below are the share of cases where that day's low held over the next 20 trading days.
| Market | Size of rise | Volume spike day | Quiet day |
|---|---|---|---|
| Korea | 1–2 ATR | 35.7% | 39.8% |
| Korea | 2–3 ATR | 49.2% | 63.5% |
| US | 1–2 ATR | 38.3% | 44.3% |
| US | 2–3 ATR | 53.1% | 52.9% |

Both closed below that day's low (dashed line) 8 trading days later (orange dot).
In Korea, the low held less often on spike days in both ranges.
In the US, the low held less often on spike days in the 1–2 ATR range, and about as often in the 2–3 ATR range.
For Bitcoin and Ethereum, there were too few spike days with the same size of rise to measure accurately.
Comparing days with the same size of rise, the low held no more often on spike days, and sometimes less often.
A low set by a bullish candle on heavy volume was no more trustworthy as support.
When a big up day also came with a volume spike, the following week moved more
Even if the chance of a rise the next day was similar, how much price swung over the following days was different.
We split days that rose 1–2 ATR into volume spike days and quiet days, and compared the daily moves over the next 5 trading days.
The numbers in the table show the average daily high-low range over the next 5 trading days as a multiple of the prior ATR (median).
A value above 1 means the daily moves that week were larger than the prior ATR.
| Market | After a spike day | After a quiet day |
|---|---|---|
| Korea | 1.19 | 0.94 |
| US | 1.09 | 0.94 |
In both Korea and the US, daily moves were larger after days that also had a volume spike.
For days that rose 2–3 ATR, too, moves were larger after spike days in Korea, while the difference was small in the US.[10]
This value is the range between each day's high and low, so it does not tell you whether price will go up or down the next week.
On big down days, moves were not larger after spike days.[11]
Extending the period to 20 trading days also narrowed the difference for up days, and in the US it became almost the same.[12]
A stop is triggered as soon as price touches it intraday, so the daily high-low range directly affects your stop.
If a big up day also came with a volume spike, a stop distance set from the prior ATR will be tighter than usual compared with the daily moves over the following week.
Days when volume spiked but price stayed put
Even when volume jumps, the close can end near the previous day's close.
On some spike days, the close moved less than 0.5 times the prior ATR from the previous close.[13]
The third Friday of March, June, September and December is the quarterly futures and options expiration day, and also the day S&P (Standard & Poor's) index rebalancing takes effect.
In the US, nearly half of the spike days where price stayed put fell on these Fridays.[14] These Fridays make up only 1.6% of all trading days.
For example, on the third Friday of September 2024, Apple's volume was nearly 7 times normal, but its close was almost unchanged from the day before.[15]

The volume bar is tall, but the candle body is short.
In Korea, about one in six of the spike days where price stayed put was a day when a scheduled MSCI (Morgan Stanley Capital International) or KOSPI 200 index rebalancing took effect.[16]
These days make up only 2.4% of all trading days.
Spike days where price stayed put overlapped with expiration days and index rebalancing days more often than usual.
On days like these, a tall volume bar cannot be read as a sign that big players have stepped in.
Days that only look like a volume spike
Sometimes the volume bar on a chart is tall, but actual trading did not increase.
- Stock splits: In data that does not convert pre-split volume to the new share count, volume looks like it spiked right after the split. After Samsung Electronics' 50:1 split in 2018, pre-split numbers were mixed into the average for 20 trading days, so the multiple came out larger than it really was.
- Trading halts and new listings: If days with no trading fall within the previous 20 trading days, the average drops and the multiple gets bigger. Right after a listing, there are not enough days to calculate the average.
In both cases, even if the volume bar or multiple is large, you cannot conclude that actual trading increased.
What to check on a volume spike day
When a volume bar is taller than usual, there are four things to check before deciding on a direction.
- Volume units: If there was a stock split within the previous 20 trading days, does your chart show volume before and after the split in the same units?
- Scheduled events: Is it the third Friday of March, June, September or December, or a day when a scheduled index rebalancing takes effect?
- Price move: Did the close move more than 1 ATR from the previous close, measured with the prior ATR?
- Stop distance: If a big up day also came with a volume spike, did you factor into your stop distance that daily moves over the following week tend to be larger than usual?
In the end, whether a spike day's candle was bullish or bearish did not tell you the next day's direction.
Only on big up days did volume tell you how large the moves would be over the following week. During that week, a stop distance set from the prior ATR is tighter than usual.
- [1] The share that rose the day after a bullish candle on a volume spike was 43.7% for 21 US large caps (51.4% for typical bullish candles) and 46.3% for 22 Korean large caps (45.2% for typical bullish candles).
- [2] Hyundai Motor, January 7, 2026: volume was 6.1 times normal, and the price change was +13.8%. Over the next 20 trading days, the close never fell below that day's low.
- [3] Meta, January 29, 2026: volume was 4.0 times normal, and the price change was +10.4%. On February 2, 2 trading days later, it closed below that day's low.
- [4] 1.48% of all trading days for Korean stocks and 0.85% for US stocks.
- [5] Since 2016, there were 11 such days for SPY (an S&P 500 ETF) and 15 for QQQ (a Nasdaq 100 ETF). The day after the UK's vote to leave the EU was June 24, 2016.
- [6] The median daily price change was 5.52% in Korea (1.17% on a typical day), 5.10% in the US (0.91% on a typical day), and 8.82% for Bitcoin and Ethereum (1.72% on a typical day).
- [7] 77.4% in Korea and 74.3% in the US.
- [8] At a 2 times threshold, it was 45.5% in Korea and 45.7% in the US. At a 5 times threshold, it was 42.3% in Korea.
- [9] For bullish candles on a spike: Korea 49.2%, US 52.1%, Bitcoin and Ethereum 79.1%. For typical bullish candles: Korea 29.9%, US 33.7%, Bitcoin and Ethereum 34.9%.
- [10] In Korea, 1.39 after spike days and 1.11 after quiet days. In the US, 1.12 and 1.07.
- [11] For days that fell 1–2 ATR, Korea was 0.88 after spike days and 0.94 after quiet days, and the US was 0.97 for both.
- [12] In Korea, 1.15 after spike days and 0.97 after quiet days. In the US, 0.97 and 0.96.
- [13] 96 days in Korea and 67 days in the US.
- [14] 29 of the 67 days (43.3%). Among the other US spike days, 7.5% fell on these Fridays.
- [15] On September 20, 2024, volume was 6.8 times the average of the previous 20 trading days, and the price change was −0.3%.
- [16] 16 of the 96 days (16.7%).