OptiNod Academy
Do gaps really fill?
We checked how many days it took for about 14,000 gaps in seven stocks over 10 years to fill. Small gaps and large gaps had very different results.
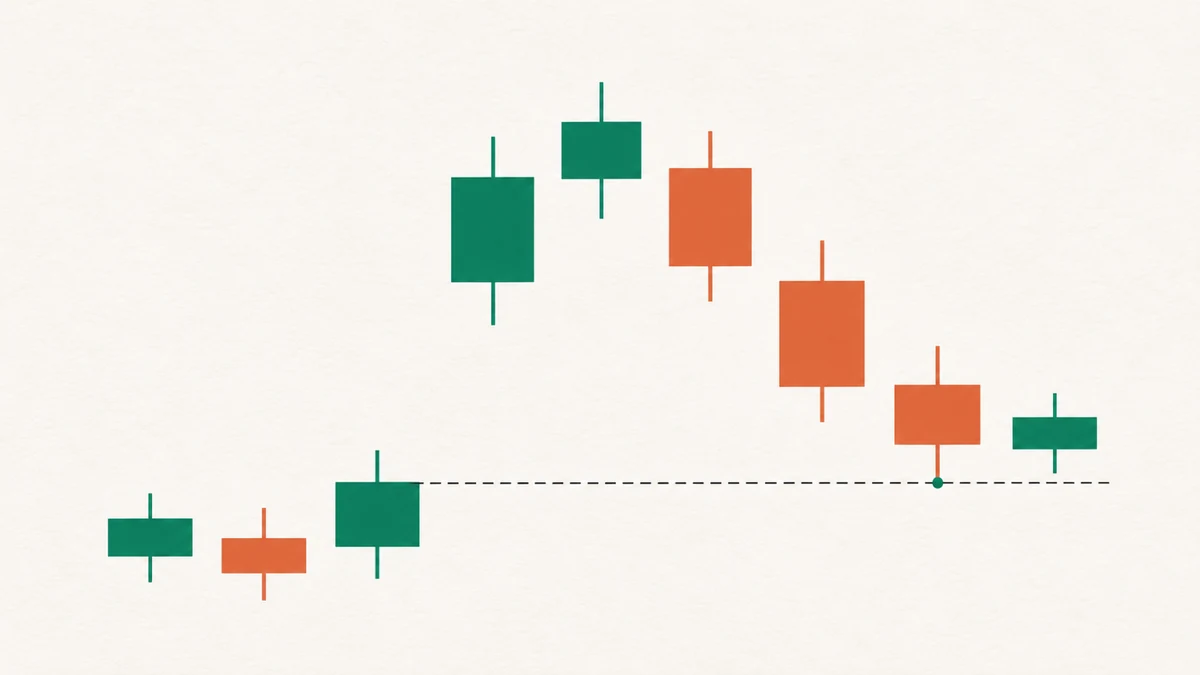
Within 60 days, 92.7% of gaps filled. Why do gaps fill?
On a chart, a gap is the difference between the previous close and today's open.
If price later touches the previous close again, the gap is said to have "filled".
Traders have a saying: "gaps eventually fill."
So when a stock opens higher, some traders short it, aiming for a move back down to the previous close. Bitcoin traders say the same about weekend gaps in CME (Chicago Mercantile Exchange) futures.
To test this saying, we picked seven tickers from the US and Korea. We went through 14,496 gaps one by one on the daily charts of SPY, QQQ, Apple, Nvidia, Tesla, Samsung Electronics and SK Hynix from 2016 to October 2026.
The result first: 92.7% of them filled within 60 trading days. However, 53.9% filled on the same day. The rest took anywhere from a few days to several months, and some gaps have not filled to this day.
For example, Nvidia opened 26% higher the day after its May 2023 earnings release, and that gap is still open.
Some gaps fill right away, and others remain open for years. We will look at what makes the difference, one factor at a time.

On the right is Samsung Electronics' gap on June 30, 2025. It touched the previous close that same day.
Small gaps fit inside a single day's move
Stock prices move a fair amount even within a single day. The average daily range over the last 14 days is called ATR (Average True Range).
From 2024 to 2026, SPY's ATR was typically 1.04% of price. This means a move of about 1% a day was normal.
When a gap is small compared with this normal range, price passes the previous close even if it moves only its usual amount that day. That is why small gaps fill easily.
The numbers show the same. There were 5,186 gaps sized 10–25% of ATR, and 76.3% of them filled the same day. That is three times out of four. All seven tickers were similar, at 74.7–77.7%.
Conversely, when a gap is larger than ATR, it is hard for a single day's move to bring price back to the previous close. Of the 767 such gaps, 12.4% filled the same day, and only 47.2% filled even within 5 days.
| Gap size (relative to ATR) | Gaps | Same day | Within 5 days | Within 20 days | Within 60 days |
|---|---|---|---|---|---|
| 10–25% of ATR | 5,186 | 76.3% | 90.6% | 95.0% | 96.6% |
| 25–50% of ATR | 5,383 | 52.3% | 80.3% | 88.8% | 92.8% |
| 50–100% of ATR | 3,160 | 29.8% | 66.8% | 81.5% | 88.7% |
| 1–2×ATR | 669 | 13.6% | 50.8% | 69.4% | 83.5% |
| 2×ATR or more | 98 | 4.1% | 22.4% | 43.9% | 62.9% |
| All | 14,496 | 53.9% | 79.3% | 88.2% | 92.7% |
The table uses the following definitions.
- Gap: The difference between the previous close and today's open. Very small gaps of less than 10% of ATR were excluded.
- Filled: For an up gap, the first day the low touches the previous close; for a down gap, the first day the high touches it.
- Period: "Within 5 days" means 5 trading days including the day the gap formed. Recent gaps whose period has not yet fully passed were excluded from that column.
- Prices: Daily bars from Yahoo for US stocks and from Naver Finance for Korean stocks. Stock splits are adjusted for, and dividends are not. Days when trading was suspended were excluded.
Because these are daily bars, they do not show how far price moved in the opposite direction before the gap filled.
So what this table shows is whether to set the previous close as a target and how long to wait for it. Stop distance does not appear in this table.
When entering at the open in the direction of a small gap, stop placement needs care. A stop placed between the open and the previous close gets hit on the day the gap fills.
For a gap of 10–25% of ATR, that stop is hit the same day three times out of four.
Large gaps have new information behind them
The Nvidia gap from the introduction was 9.1 times ATR. Tesla also opened 14.5% higher on October 24, 2024. The previous close was $213.65 and the open was $244.68, and this gap was 3.7 times ATR.
Both gaps formed the day after an earnings release, and neither had filled by the end of October 2026.
When new information about a company's value comes out, such as earnings, price trades at a new level that reflects that information. The previous close is the price from before the information came out.
So a large gap has little reason to return to the previous close. There were 98 gaps of twice ATR or more, and 62.9% of them filled within 60 days.
Not every large gap stays open. SPY opened 4.0% lower on August 5, 2024, and that gap filled 4 trading days later. The gap from its 10.4% lower open on March 16, 2020 also filled 16 trading days later.
If a trade is entered on the expectation that a large gap will fill, the waiting period has to be set first. Of gaps 1–2 times ATR, 50.8% filled within 5 days and 69.4% within 20 days.
If the gap has not filled by the end of the set period, it is better to close the trade. This approach is called a time stop.
Waiting while relying only on the saying "it eventually fills" ties up capital in the meantime.
The same 1% gap is a different size in each ticker
ATR differs from ticker to ticker. From 2024 to 2026, ATR was typically 1.04% of price for SPY and 4.37% for Tesla.
So a 1% gap is a large gap in SPY, almost equal to ATR, and a small gap in Tesla, less than a quarter of ATR. In practice, the share of 1–2% gaps that filled the same day was 30.4% for SPY and 55.9% for Tesla.
| Ticker | ATR (% of price, 2024–2026 median) | 1–2% gaps | Filled same day |
|---|---|---|---|
| SPY | 1.04% | 194 | 30.4% |
| QQQ | 1.47% | 328 | 26.8% |
| Apple | 2.11% | 376 | 31.1% |
| Samsung Electronics | 2.84% | 536 | 40.7% |
| Nvidia | 3.52% | 723 | 46.1% |
| SK Hynix | 4.14% | 720 | 49.7% |
| Tesla | 4.37% | 681 | 55.9% |
The larger a ticker's ATR, the higher the same-day fill rate of its 1–2% gaps generally was.
Measuring gap size against ATR narrows this difference. For gaps of 50–100% of ATR, 25.1–32.6% filled the same day in all seven tickers.

In SPY (September 17, 2026) it was 1.39 times ATR and filled 31 trading days later.
In Tesla (September 2, 2026) it was 0.31 times ATR and filled the same day.
So a rule such as "gaps of 1% or more" means something different in each ticker.
In the end, a gap's size is meaningful only when compared with that ticker's ATR.
Up gaps fill less often in rising stocks
Among gaps of at least half of ATR, up gaps filled less often than down gaps in all seven tickers. In SPY, 73.3% of up gaps and 89.0% of down gaps filled within 20 days.
| Ticker | Up gaps (within 20 days) | Down gaps (within 20 days) |
|---|---|---|
| SPY | 73.3% | 89.0% |
| QQQ | 74.6% | 87.6% |
| Apple | 65.5% | 78.7% |
| Nvidia | 69.9% | 87.3% |
| Tesla | 71.5% | 81.2% |
| Samsung Electronics | 78.5% | 83.3% |
| SK Hynix | 74.8% | 85.2% |
Up gaps filled less often because all seven tickers rose from 2016 to October 2026. SPY went from $190.20 to $755.72.
As price keeps rising, the previous close below an up gap gets farther away. Of the 1,039 gaps still unfilled after 60 trading days, 802 (77%) were up gaps.

The shading marks 7 up gaps of at least half of ATR, and each dashed line is the previous close before a gap.
As the stock kept rising, none of the 7 had filled by the end of October 2026.
This is the 60-trading-day stretch in Samsung Electronics with the most such gaps.
When shorting an up gap in a rising stock, the reference is the up-gap rate in this table. Stocks that fell over a long period are not in this sample. Whether the same result holds for such stocks was not checked.
Most CME Bitcoin gaps fill too, but some remain open
CME Bitcoin futures did not trade on weekends until May 2026. If Bitcoin moved in the meantime, Monday's open differed from Friday's close. This is the CME gap.
Since May 29, 2026, CME has also traded on weekends, so no new weekend gaps have formed since then.
Why Bitcoin's weekends stay quiet even after CME opened on weekends is examined separately in Why is Bitcoin quiet on weekends?.
From December 2017 to May 2026 there were 338 weekend and holiday gaps. Of these, 56.2% filled the same day and 91.4% within 60 days, similar to stocks.
Weekends after the last Friday of each month were excluded because that is when the futures contract month rolls over.
| Gap size (relative to Friday close) | Gaps | Same day | Within 5 days | Within 20 days | Within 60 days |
|---|---|---|---|---|---|
| 0.25–0.5% | 37 | 83.8% | 97.3% | 97.3% | 97.3% |
| 0.5–1% | 60 | 65.0% | 88.3% | 90.0% | 93.3% |
| 1–2% | 77 | 45.5% | 83.1% | 88.3% | 89.6% |
| 2–4% | 65 | 46.2% | 80.0% | 90.8% | 93.8% |
| 4% or more | 49 | 20.4% | 57.1% | 69.4% | 75.5% |
| All (including under 0.25%) | 338 | 56.2% | 83.7% | 89.1% | 91.4% |
Among large gaps of 4% or more, only 75.5% filled within 60 days.
On July 27, 2020, a gap formed between a Friday close of $9,615 and a Monday open of $9,925, and it had not filled by the end of October 2026. The gap from $19,965 to $21,250 on March 13, 2023 is also still open.

Since then, price has not come back down to the Friday close of $9,615 (dashed line), and the gap remains open as of the end of October 2026.
Some of the gaps that did fill took a long time. The gap from an 8.0% lower open on December 6, 2021 filled on February 26, 2024, 558 trading days later. It took more than two years.
This is why the saying "CME gaps fill" is hard to use as the basis for a profit target.
What to check when a gap appears
- Gap size: What percentage of the ticker's ATR is the difference between the previous close and the open? Under 25% of ATR is a small gap, and ATR or more is a large gap.
- Waiting period: Have you decided how long to wait: the same day, 5 days or 20 days? For gaps of 1–2 times ATR, only 13.6% filled the same day.
- Direction: Is it an up gap in a rising stock? If so, the reference is the up-gap rate. For SPY it was 73.3% within 20 days.
- New information: Did the gap come with new information, such as the day after an earnings release? The earnings gaps in Nvidia (9.1 times ATR) and Tesla (3.7 times) did not fill.
- Price data: Is it a gap on an ex-dividend date? Does the chart use split-adjusted prices? Gaps on weekends when the CME contract month rolls over were excluded from the 338 above.
The similarly named fair value gap refers to an empty zone formed across three candles. It is a different concept from the gaps in this article, so the rates in this article do not apply to fair value gaps.
Gaps that close in the gap's direction fill less often
Among gaps of at least half of ATR, 2,890 did not fill the same day. Splitting these gaps by the direction of that day's close showed a large difference.
- Closed in the gap's direction: An up gap that ended as a bullish candle, or a down gap that ended as a bearish candle. 40.1% filled within 5 days.
- Closed against the gap's direction: An up gap that ended as a bearish candle, or a down gap that ended as a bullish candle. 65.7% filled within 5 days.
A close in the gap's direction means price ended the day even farther from the previous close.
Such gaps filled only about four times out of ten within 5 days.
Gaps that opened outside the prior 20-day price range also filled less often. The difference was small, though.
Within 5 days, 43.6% of gaps that opened outside the range filled, compared with 51.4% of those that opened inside it.
In the end, whether a gap filled depended heavily on how large the gap was relative to the ticker's ATR and which way that day's candle closed.