OptiNod Academy
Wave charts — A candle does not show the order of its high and low
Glenn Neely's wave chart plots highs and lows in the order they occurred. Using BTC data, we check how a close line, bar order, the day boundary and the time frame change the monowave count.
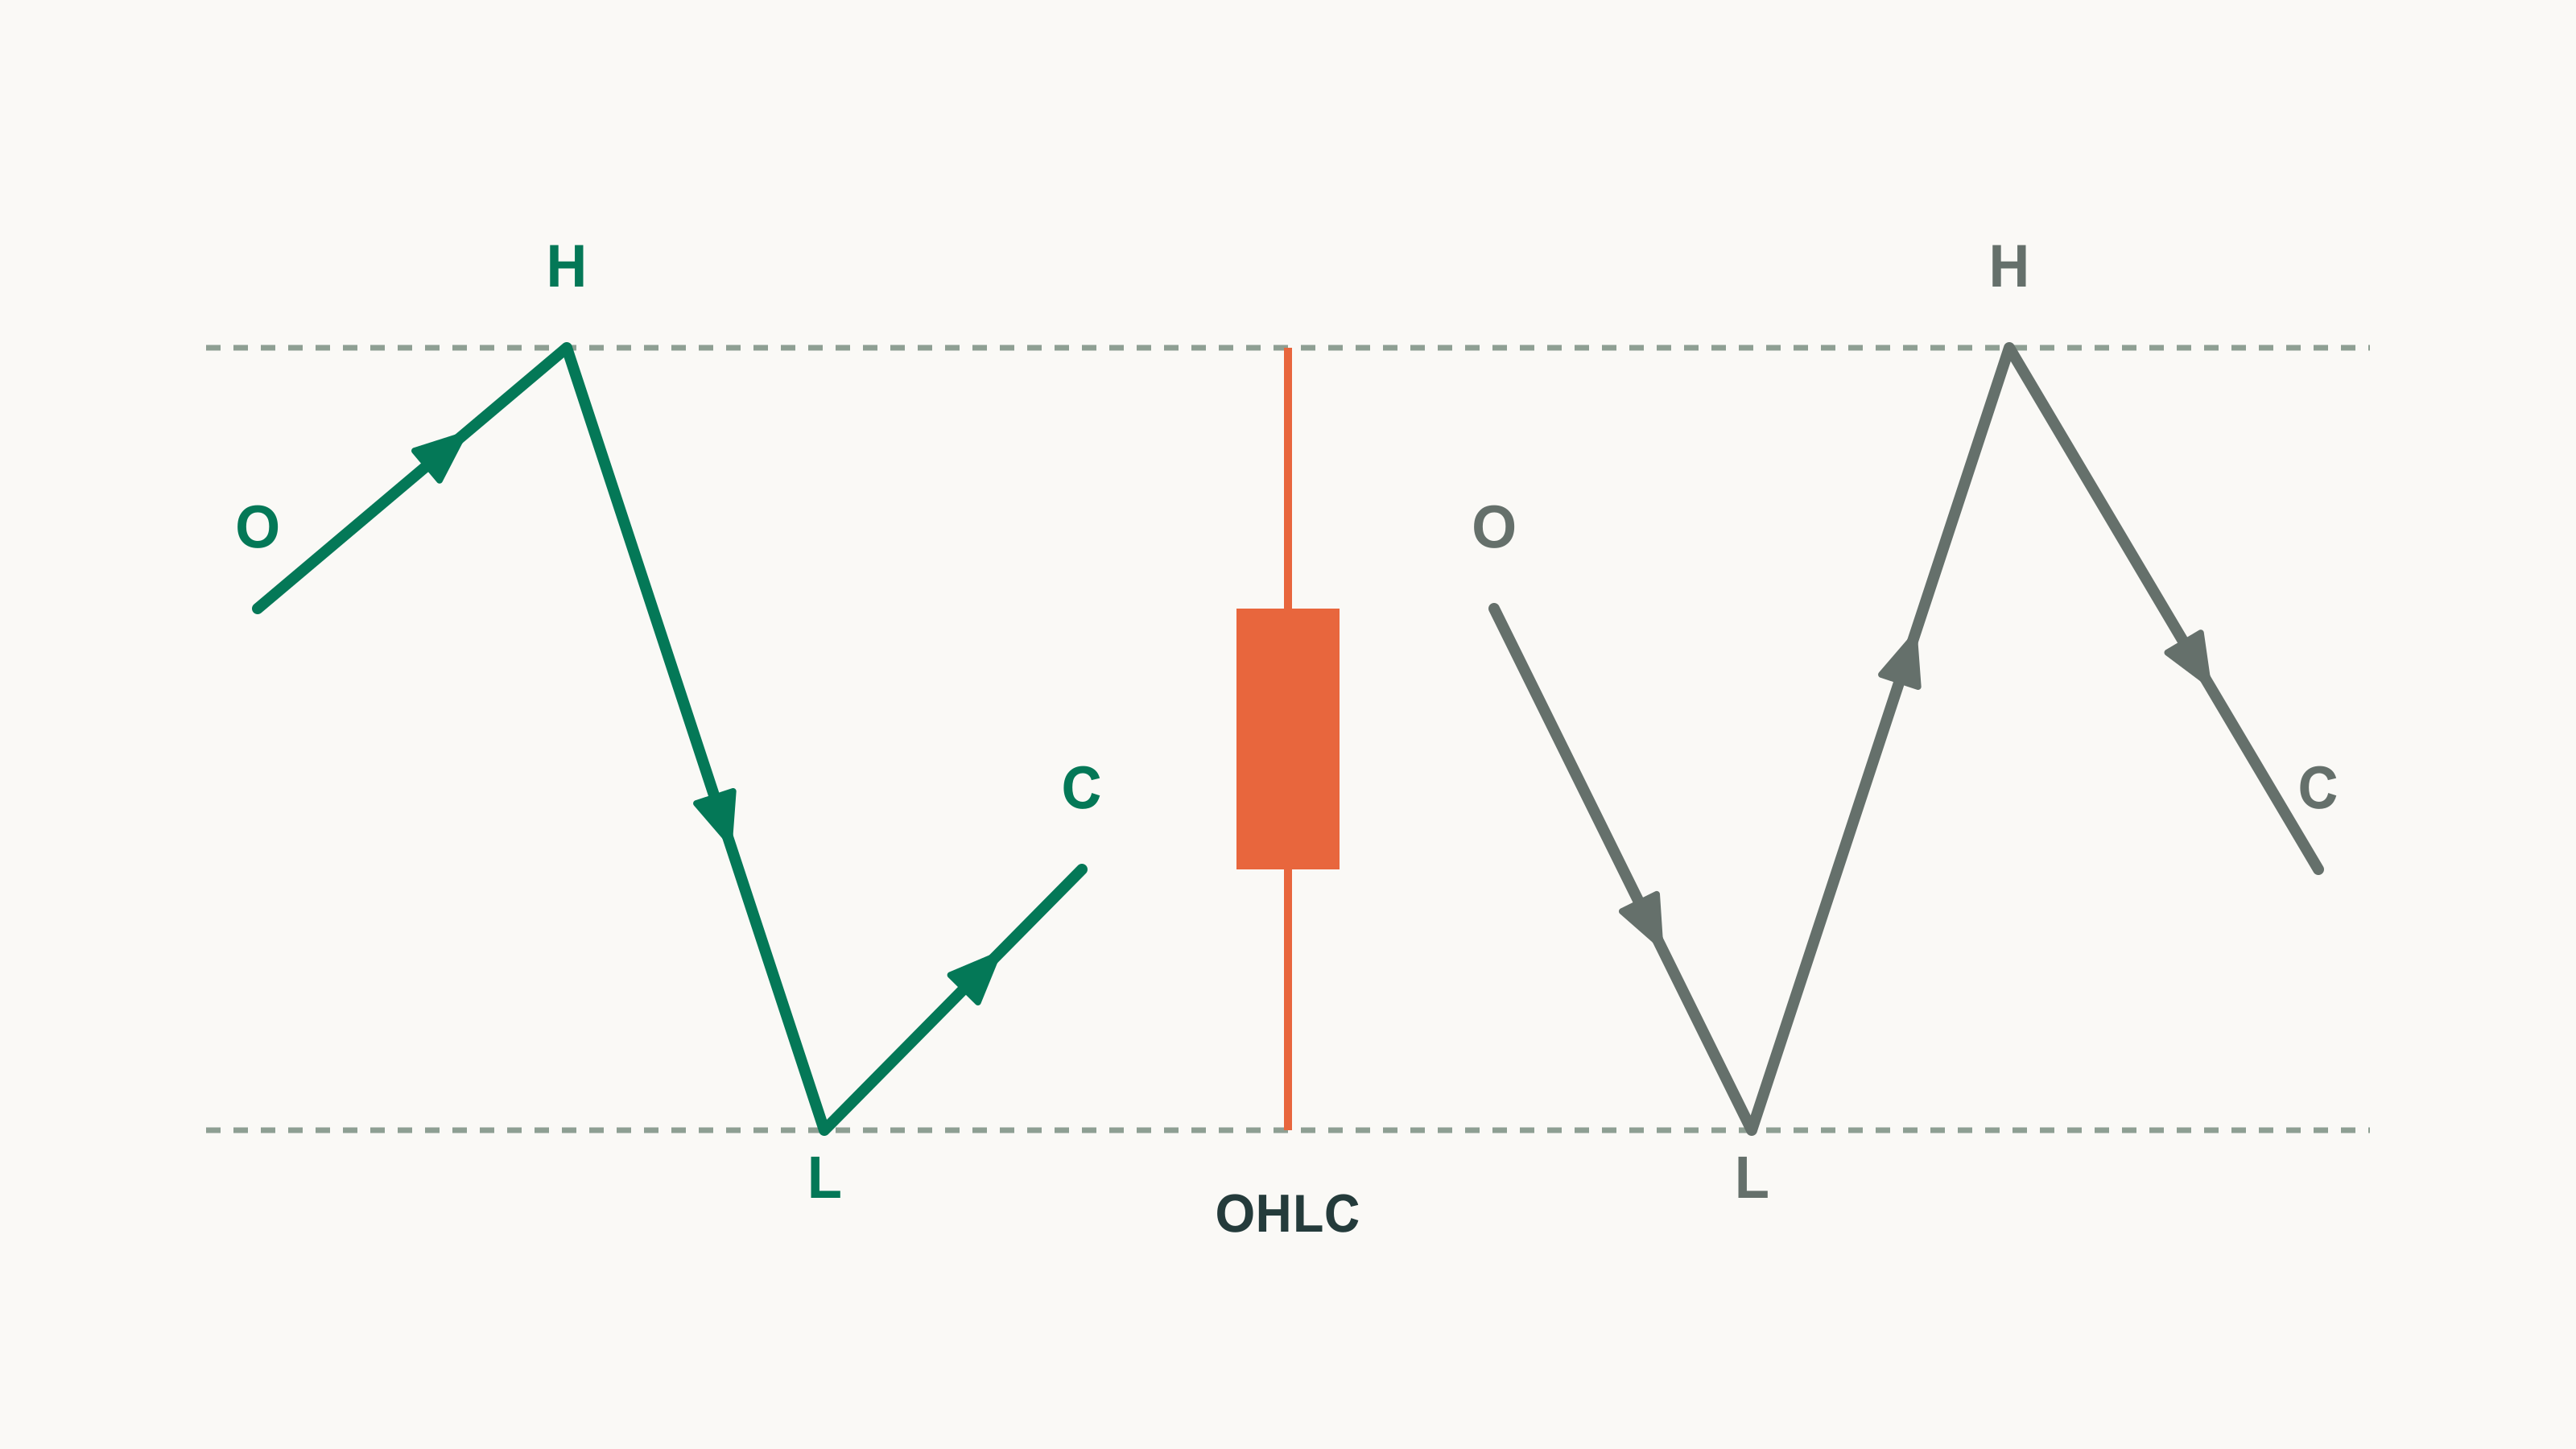
A single candle doesn't tell you when its high and low occurred. Check the order on lower-time-frame bars before you count waves.
Part 1 established that a monowave ends where price changes direction. But where direction changes depends on which points you plot and in what order, which is why Glenn Neely laid down detailed rules for choosing data and plotting points.
Many traders pull up a close-only line or a candlestick chart and start numbering right away. A close line erases intraday highs and lows. A candle shows both, but not which came first. Since monowaves are separated by changes of direction, getting the order wrong gets even the monowave count wrong.
Using real data, we'll show one BTC daily bar producing either 3 or 5 monowaves depending on the order of its high and low. Then we cover cash data, the day boundary in a 24-hour market, the time frame and the number of monowaves on screen, and why points are plotted at equal spacing.
A close line erases intraday highs and lows
Neely regards close-only data, whether monthly, weekly, daily or hourly, as the least reliable data for wave analysis. A close doesn't tell you how far price rose and fell within the period, and there's no reason a period's end should coincide with a pattern's end. So use a close line only when no other data exists.
Connect the 16 BTC daily bars from February 26 to March 12, 2024 in two ways, and the difference is large.
| Item | Close line | High/low wave chart |
|---|---|---|
| Number of monowaves | 8 | 20 |
| Largest decline | Mar 4 close $68,246 → Mar 5 close $63,724 | Mar 5 high $69,000 → low $59,005 |
| Size of decline | 6.63% | 14.49% |
On a close line, this stretch's decline measures less than half its real size, and the retracement ratios from Part 3 come out different too.

Count waves on a close line and the intraday highs and lows are gone before you measure anything. Redraw the chart with highs and lows before measuring any ratio.
A candle does not tell you whether the high or the low came first
Because a candle shows both the high and the low, it's easy to assume one daily bar tells you everything. But it draws them on one vertical line, as if they happened at the same moment. On an outside bar, whose high is above and low is below the previous day's, Neely's interpretation depends on which came first.
- Low first: the new high can be read as a fifth wave continuing.
- High first: the preceding advance may be a three-part correction, and the decline that follows becomes more likely to be the start of a new downtrend.
Either way, the order alone doesn't settle the count; it shifts the odds between counts.
The BTC daily bar of March 5, 2024 is an outside bar. Its high of $69,000 is above the previous day's high of $68,499, and its low of $59,005 is below the previous day's low of $62,300. On hourly bars, the high came at 15:00 UTC and the low at 19:00. The high came first, and price fell 14.49% in four hours. Flip just the March 5 order, connect the highs and lows of March 4–6, and the monowave count changes.
| March 5 order | March 4–6 monowaves | Count |
|---|---|---|
| Actual (high first) | 62,300→69,000 up, 69,000→59,005 down, 59,005→67,641 up | 3 |
| Flipped (low first) | 62,300→68,499 up, 68,499→59,005 down, 59,005→69,000 up, 69,000→62,779 down, 62,779→67,641 up | 5 |
The candles look identical. In the flipped version, $69,000 becomes a new high after a decline and reads as the advance continuing.

On an outside-bar day, don't assign wave numbers from the candle's shape. First check when the high and low occurred on lower-time-frame bars.
Below is an example trade plan, separate from Neely's pattern rules. It spells out a procedure for outside bars, using the numbers from March 5, 2024.
- Target: a BTC daily outside bar that exceeds both the previous day's high and low, with a high–low range of at least 9% of the low (16.9% on March 5, 2024).
- Order check: check the times of the high and the low on hourly bars. If both fall inside the same hourly bar, skip this plan.
- Hold-off condition: if the high came first, take that day's low ($59,005) as the last point. Don't buy on a continued-advance count until a daily bar closes above the outside bar's high ($69,000).
- Entry: the close of the first daily bar that closes above the outside bar's high (the close of $72,078 on March 11, 2024).
- Stop: below the lowest price from the day after the outside bar to the entry day ($62,779 on March 6, 2024). That is 12.9% from the entry price.
- Invalidation: if price falls below the outside bar's low ($59,005) before entry, drop this plan and review the count from the beginning.
Guessing the order from candle color on BTC daily bars is wrong more than one time in ten
A common shortcut that skips lower-time-frame bars is to assume the low came first on a bullish candle and the high first on a bearish one. We tested this guess on BTC daily bars against the actual order on hourly bars.
- Period: January 1, 2018 to October 21, 2026, 3,216 daily bars
- Days whose order could be fixed from hourly bars: 3,189
- Days the color guess got wrong: 376 (11.8% of the 3,189 with a fixed order)
- Days whose order could not be fixed even from hourly bars: 27
The hourly order on a few days is shown below. Times are UTC.
| Date | Order seen on hourly bars | Result |
|---|---|---|
| March 14, 2023 | High $26,387 (13:00) → low $23,976 (21:00) | Bullish candle, but high first |
| August 2, 2020 | High $12,123 and low $10,519 both inside the 04:00 bar | Order not fixed |
| May 19, 2021 | High $43,585 (00:00) → low $30,000 (13:00) | Order fixed |
| March 12, 2020 | High $7,966 (00:00) → low $4,410 (23:00) | Order fixed |
March 14, 2023 is a bullish candle with an open of $24,112 and a close of $24,670. The color guess makes the high the day's last point, but it was actually the low. On August 2, 2020, the day's entire 15.3% range happened inside a single hourly bar. Our data goes down only to hourly bars, so days like that are marked as having no fixed order. On wide-range days such as May 19, 2021 and March 12, 2020, though, a high in the first hour makes the order easy to set.
Candle color doesn't tell you the order. Check lower-time-frame bars, and if the high and low fall inside the same lower bar, record both orders.
Use cash data, and in crypto fix one market
On crypto charts, some traders flip between spot and perpetual futures to pick highs and lows. Neely sees inherent problems in futures charts. A dated futures contract trades at a gap to cash and converges toward it as expiry approaches, and some futures markets have so few participants that large money can move the price. So he says to use cash data whenever possible. The five-step analysis procedure on the official NEoWave blog (2025) likewise starts with getting cash data that shows the order in which highs and lows occurred.
Crypto perpetuals have no expiry, so convergence at expiry isn't an issue as such. Instead they track spot through funding, with no guarantee that their highs and lows match spot at any given time. This series uses only Binance spot data and didn't measure the gap to perpetuals, so we can't say how large it is. Nor could we find official material in which Neely addresses crypto perpetuals directly.
The fix is simple: use one instrument from one exchange per wave chart. Mix spot and perpetual highs and lows, and you end up measuring ratios between different prices.
In a 24-hour market, first decide where the day ends
A 24-hour market has no session close, so you have to set the day boundary yourself. Neely experimented with several ways of splitting the day in cash gold, silver and forex.
- A chart using only one country's trading-hours data: could be analyzed.
- A chart stitching prices from several countries' markets into one 24-hour line: often could not be analyzed.
- Setting your own market's closing time as the day boundary and using the high and low of those 24 hours: a method Neely had not tested but said seemed workable.
Crypto has no national trading hours, so in practice you're left with something close to the third method, one Neely never tested himself. Where you put the boundary also matters: build a daily wave chart for the 31 days of March 2024 from BTC hourly bars, change only the day boundary, and the monowave count changes.
| Day boundary | Number of monowaves |
|---|---|
| 00:00 UTC (9 a.m. Korea time) | 41 |
| 08:00 UTC | 44 |
| 12:00 UTC | 42 |
| 16:00 UTC | 48 |
This series uses the 00:00 UTC boundary, the same as Binance daily bars. Once you set a boundary, don't change it mid-analysis, and before comparing with someone else's count, check that your boundaries match.
Choose the time frame by the number of monowaves on screen
It's tempting to pick a time frame from the bars you usually watch. NEoWave material instead sets standards for how many data points or monowaves belong on one chart, and the book and later material differ.
- The book: to study one market you need at least daily, weekly and monthly charts. Plot about 60 data points on the first daily chart, and for the next chart halve the period and plot about 30.
- 2025 official blog: in step 3 of the five steps, adjust the complexity so every chart has at least 13 and at most 55 monowaves. The ideal count is 21–34. These numbers are not in the book.
The blog doesn't say how to hit that count, so we compared counts across time frames. BTC wave charts for March 2024 differ widely by time frame.
| Time frame | Monowaves | Bars with undetermined order |
|---|---|---|
| Weekly | 5 | none |
| Daily | 41 | none |
| 4-hour | 276 | 15 of 186 |
| Hourly | 1,107 | all |
These are raw counts without the Rule of Neutrality, so a real count may be smaller, and the hourly count was taken without a fixed high–low order. The range is still clear. For this month, the weekly chart falls short of 13, and the 4-hour and hourly charts far exceed 55. Only the daily chart falls within 13–55.

When you move to lower time frames, mind the limits of your data. Ours goes down only to hourly bars, so on an hourly chart not a single high–low order can be fixed. Counting waves on an hourly chart takes smaller bars than that.
Plotting points at equal spacing is what Neely found by testing
Drawing the horizontal axis in actual clock time seems more precise. On a wave chart, each value is plotted at the middle of its time unit, each new point is placed at the same horizontal spacing as the previous one, and the points are joined with straight lines. Even if the high came at 15:00 UTC and the low at 19:00, they sit side by side on the axis, regardless of the actual times.
In a 2006 official Q&A, a reader asked whether this method throws away the time between the high and the low. Neely's answer:
- The problem of unknown times: a day's high or low may have occurred in the first minute or in the last hour.
- His initial view: early in his career he thought plotting by actual time would be better.
- Test results: he tested bar charts, high–low averages, closes, charts reflecting exact times, and equal-spacing charts, and equal spacing was "far superior to the others".
- The method he dropped: he stopped using charts reflecting exact times 20 years before that answer. He said he didn't know why they weren't better, only that in practice they weren't.
This isn't a rule proven by theory; it's a standard drawn from Neely's experience with various methods.
Our figures are drawn the same way. Each daily bar gets two points placed at one quarter and three quarters of the bar, with the order set from hourly bars. On the right of the second figure, the March 5 high and low were actually four hours apart, but on the chart they have the same spacing as two points on any other day. Time information only sets the order of the high and low; the chart itself is drawn at equal spacing, and waves are counted on it. When comparing wave durations, this series likewise counts one step between points as one time unit and mentions actual time only as a side note. If you're tempted to redraw the axis in actual time, remember that Neely tested that approach and dropped it.