OptiNod Academy
Retracement Rules — Using ratios to narrow the prior wave to :5 or :3
Neely's Retracement Rules 1–7 use the m2/m1 and m0/m1 ratios to narrow down the possible structures of the wave that just ended.
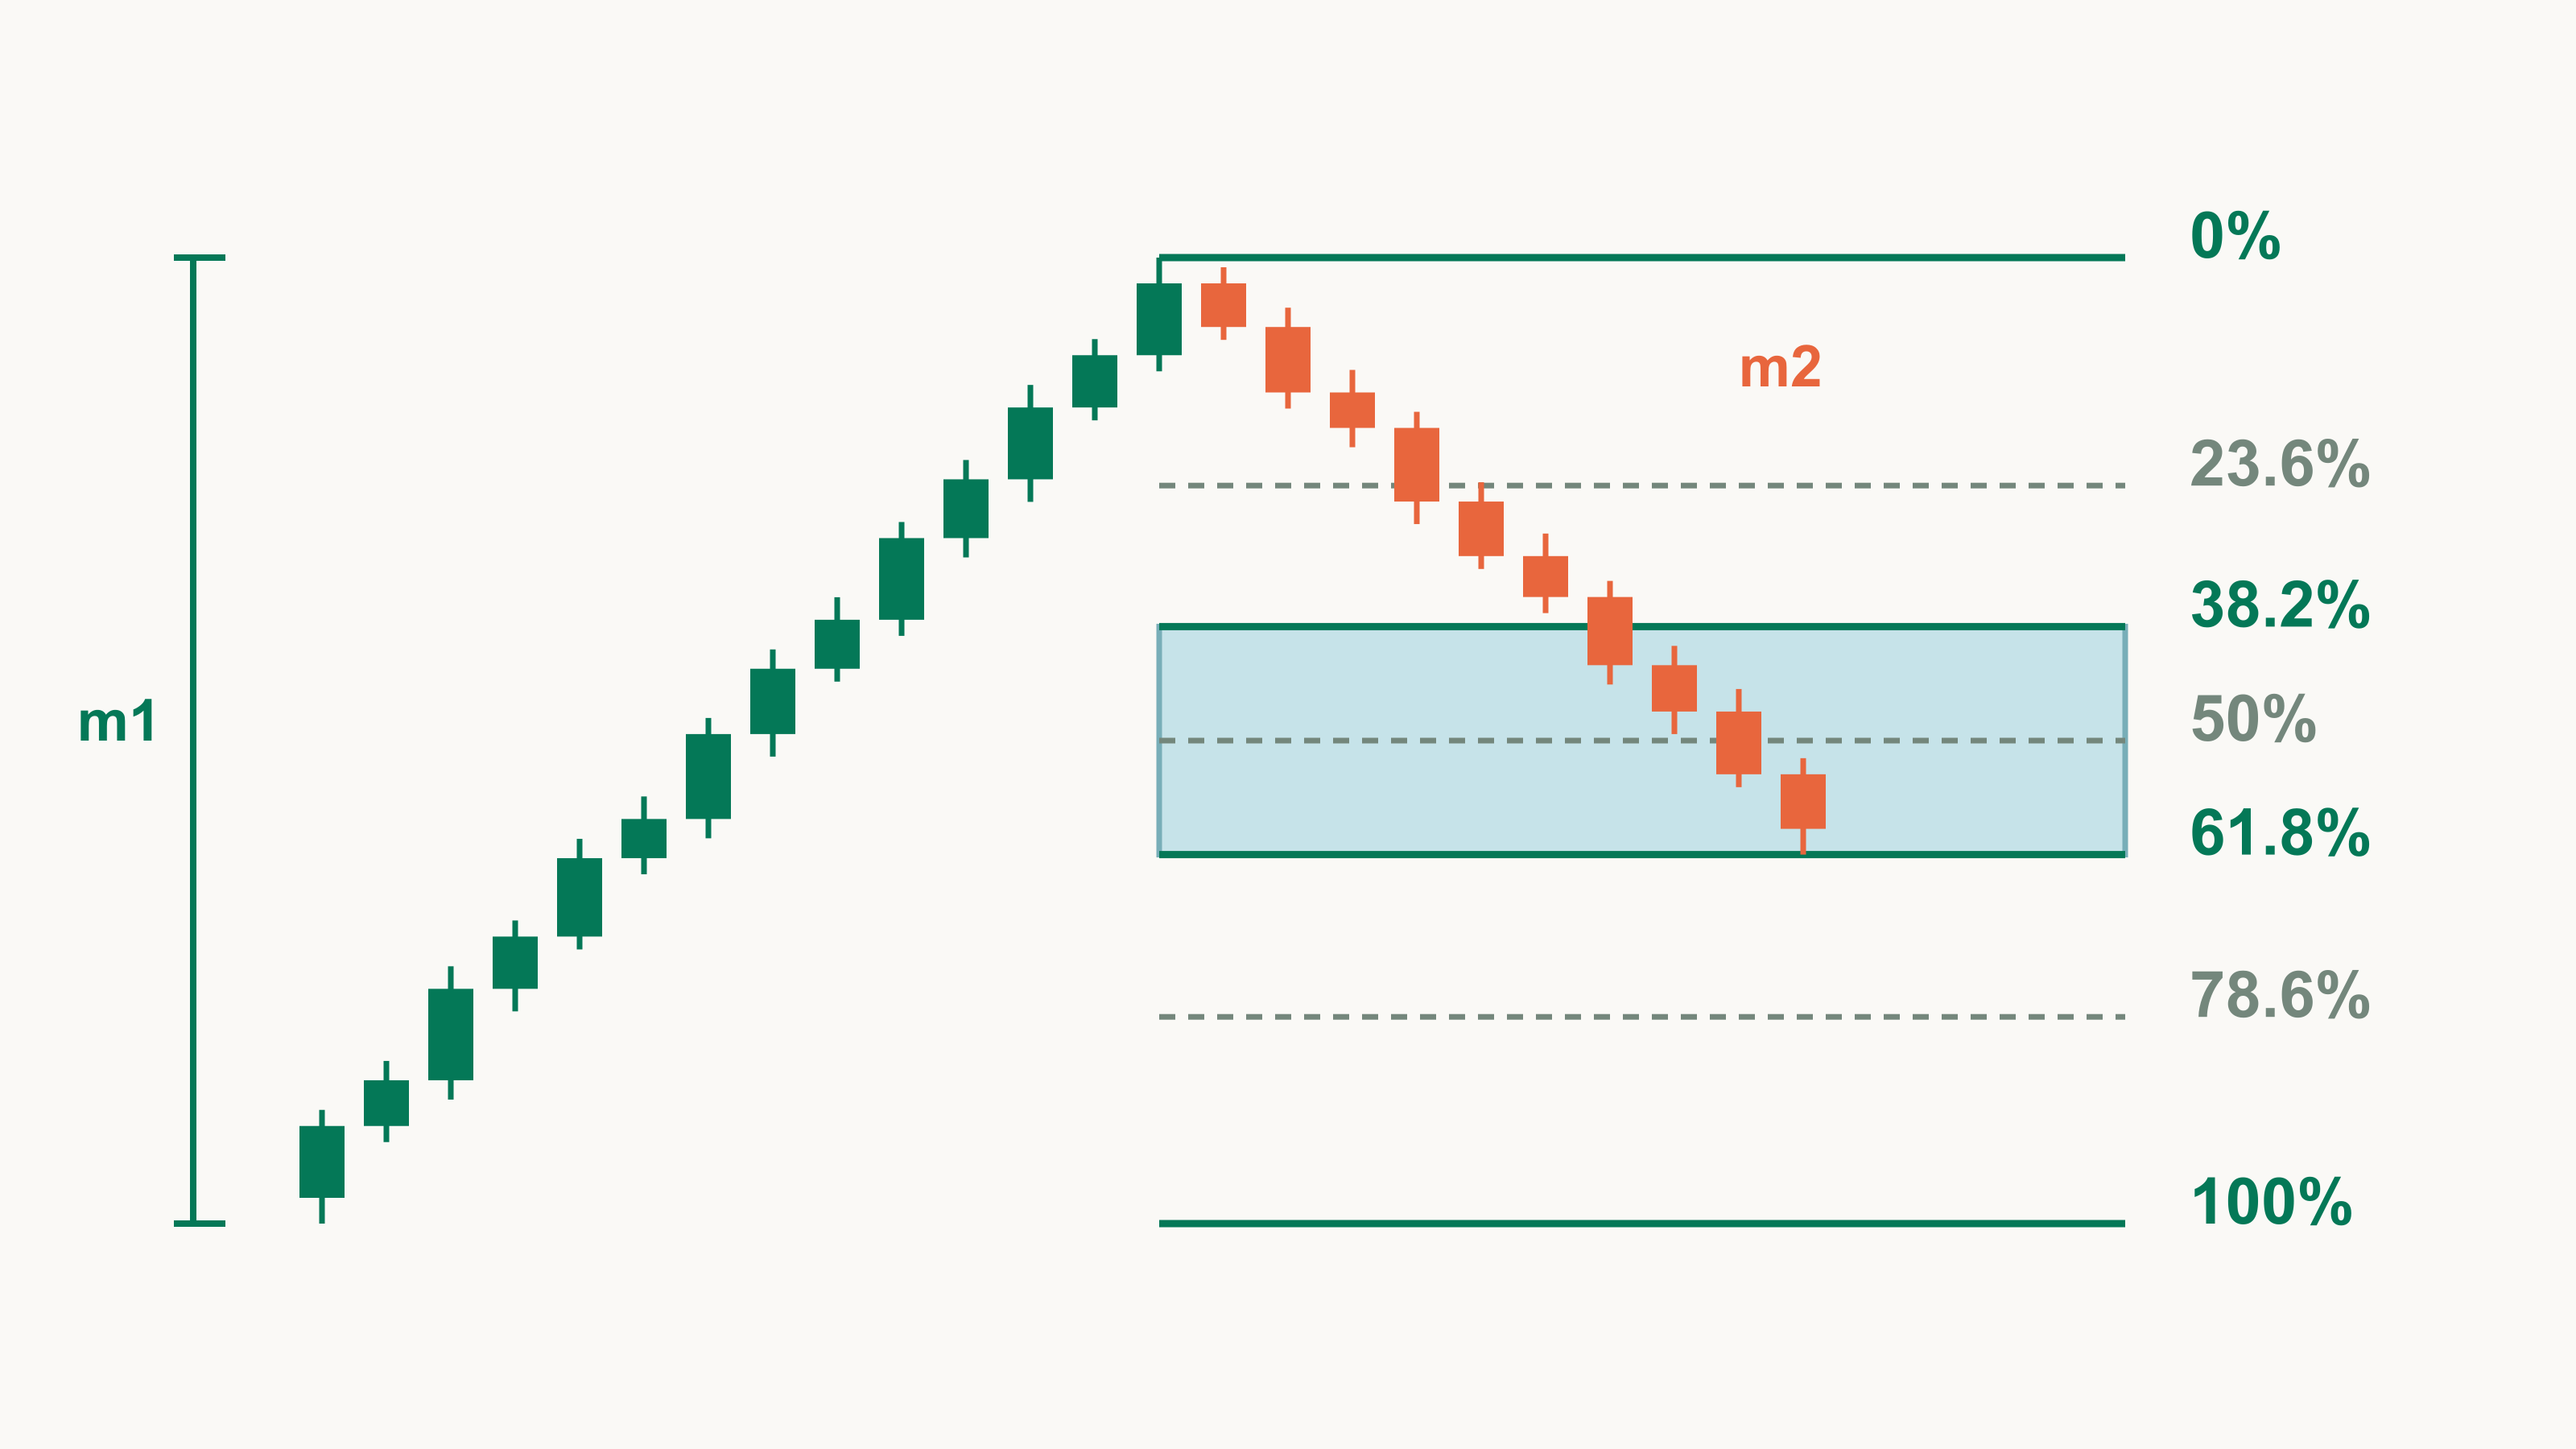
Neely doesn't use Fibonacci retracement ratios as price targets. He uses them to narrow down whether the prior wave is a :5 or a :3.
Part 2 showed that the same candles can produce different wave shapes depending on the order in which highs and lows occurred. Now we pick one monowave on such a wave chart and compare its price length with the moves before and after it. Glenn Neely formalized this step as the Retracement Rules.
Fibonacci retracements usually serve as targets: after a rally you draw lines at 38.2% or 61.8%, and when price comes down to one, you get ready to buy the dip.
Neely measures the same ratios after the retracement has ended. A single monowave on its own can't tell you whether it's an impulse or a correction, so he judges it by the size of the moves around it: how much the next move retraced it, and how large the previous move was. The structure label :5 means impulsive and :3 means corrective.
So this procedure doesn't produce a buy price. It produces a list of candidate structure labels for the prior wave. Part 4 uses this list to group waves into patterns.
Once you fix m1, the move before is m0 and the move after is m2
Choose one monowave to analyze and call it m1. The move right after m1 is m2, and the move right before it is m0. Likewise, moves further back are m(-1), m(-2), and moves further ahead are m3, m4. The numbers are positions relative to the wave under examination. Once m1 is judged, the m2 you just used becomes the new m1 and you repeat the calculation.
The calculation is just two divisions, and it works the same whether m1 rises or falls.
- Rule number: price length of m2 ÷ price length of m1
- Condition letter: price length of m0 ÷ price length of m1
The result goes at the end of m1 in short form, like "R-2d" for Rule 2, Condition d. Here's the notation for the August 2024 rebound on a BTC weekly wave chart, taken as m1.
| Segment | Move | vs. m1 |
|---|---|---|
| m0 | Jul 29 $70,080 → Aug 5 $49,000 decline | 153.4% |
| m1 | Aug 5 $49,000 → Aug 8 $62,745 advance | 100% |
| m2 | Aug 8 $62,745 → Aug 15 $56,079 decline | 48.5% |
An m2/m1 of 48.5% is at least 38.2% and below 61.8%, so it is Rule 2. An m0/m1 of 153.4% falls in Rule 2's Condition d (100% to 161.8%). The end of m2 was confirmed on August 23, when price went back above the m1 high.
Before assigning a number, check that m1 is either a single monowave or a stretch already condensed into one pattern. Take an arbitrary run of monowaves as m1 and every calculation after it is useless.
m2 ends when price leaves the range of m1
Take only the first opposing move after m1 as m2, and you may end m2 too early. Neely's Rule of Observation fixes the end of m2 by price boundaries. For a rising m1, there are two cases.
- When price exceeds the m1 high again: the lowest point between the m1 high and the new high is the end of m2.
- When price breaks the m1 low first: the first place price turns up after breaking the low is the end of m2.
If price rises and falls several times inside m1's range before that, the whole group is m2. This is called a monowave group, written mg2. It contains an odd number of monowaves, such as 3 or 5, and when m1 is a single monowave it's usually 5 or fewer, though there are exceptions. m0 is found the same way, running time backward.

On BTC weekly in February–March 2021, the rule number depends on how you define m2. m1 is the decline from $58,353 on February 21 to $43,000 on February 28.
| How m2 was defined | End of m2 | m2/m1 | Rule | Notation |
|---|---|---|---|---|
| First rebound only | Mar 3 $52,640 | 62.8% | 3 (4 by the literal table) | R-3d |
| Rule of Observation (3 monowaves) | Mar 13 $61,844 | 122.7% | 5 | R-5b |
The first rebound stopped at $52,640. Price then fell back inside m1's range to $49,275 and, on March 13, broke above m1's starting point of $58,353. By the Rule of Observation, all three moves together form m2. m0 is the rising group that began at $37,989 on February 8. It is 132.6% of m1, so it is Condition b under Rule 5, and Condition d under Rule 3 when only the first rebound is considered.
m2 is confirmed only when price moves beyond the start or end of m1; any ratio before then belongs to an m2 still in progress. Assign the rule number too early and you'll flip between Rule 3 and Rule 5 for the same rebound.
Rule numbers split m2/m1 into seven ranges
Neely's table divides m2/m1 into the following seven ranges. Note Rule 3, which covers only the single value of 61.8%.
| Rule | m2/m1 (price) |
|---|---|
| 1 | below 38.2% |
| 2 | 38.2% to below 61.8% |
| 3 | exactly 61.8% (58–66% with tolerance) |
| 4 | above 61.8% to below 100% |
| 5 | 100% to below 161.8% |
| 6 | 161.8% to 261.8% |
| 7 | above 261.8% |
When m2 retraces 61.8% of m1, m1 sits on the border between corrective and impulsive, so its structure is hardest to judge. In this system 61.8% isn't where a retracement will stop; it's the reading that leaves the most doubt.
Rule 4 has an extra category set by m3/m2.
- Category i: m3 is 100% to below 161.8% of m2
- Category ii: 161.8% to 261.8%
- Category iii: above 261.8%

BTC daily in late February 2026 illustrates Rule 4. m1 is the advance from $62,510 on February 24 to $69,989 on February 25. The first decline alone gives Rule 2; grouping by the Rule of Observation gives Rule 4.
- First decline: it stopped at $66,500 on February 26, 46.7% of m1, so Rule 2.
- m2 group: before exceeding the m1 high, price fell again to $63,030 on February 28. It is a group of three monowaves and 93.1% of m1, so Rule 4.
- m0 and m3: m0 is 101.8% of m1, so Condition c. m3 rose to $70,096 on March 2, 101.5% of m2, so Category i.
- Notation: R-4c-i
Two values here sit near a boundary. An m0/m1 of 101.8% is close to 100%, the line between Conditions b and c, so we check both paragraphs. An m3/m2 of 101.5% is likewise close to Category i's lower bound of 100%; a slightly shorter m3 would have fallen outside the category table. Whether m0 can be treated as one group also needs a separate check. This m0 is a group of 15 monowaves, beyond the usual range (5 or fewer), and its starting point of $70,127 exceeds the end of m1 by only 0.2%.
Conditions a–f are set by the size of m0
Don't read the condition letter as trend strength. It tells you which paragraph to read in the Pre-Constructive Rules of Logic. Where the rule number describes m2 against m1, the condition describes m0 against m1, and the boundaries differ by rule.
- Rule 1: m0/m1 split at 61.8%, 100% and 161.8% into a–d
- Rule 3: five boundaries from 38.2% to 261.8%, giving a–f
- Rules 5–7: split at 100%, 161.8% and 261.8% into a–d
Sometimes a condition leaves just one candidate. On October 10, 2025, BTC fell from $122,550 at 1 p.m. UTC to $102,000 at 9 p.m., and rebounded to $113,322 at 3 a.m. on October 11. On the daily wave chart, take this rebound as m1.
- m2: price fell to $109,562 on October 11, 33.2% of m1, so Rule 1.
- m0: the preceding decline is 181.5% of m1, so it is Condition d, above 161.8%.
- Result: under Rule 1 Condition d, the only possible structure is :5. Write :5 at the end of m1.
Other condition paragraphs walk you through several conditions in turn, looking as far as m3, m4 or m(-1), m(-2) to add or remove labels. Time conditions come in at this stage too. For example, Rule 1 Condition a says to write :5 at the end of m1 if m2 took at least as much time as m1 to form.
Read price ratios with tolerance, and count time comparisons to a single unit
Don't throw out a 60% retracement for missing a "minimum 61.8%" standard. Price ratios have a tolerance. Saying two waves are in a 61.8% relationship means the smaller wave is 58–66% of the larger one. "Almost" and "close to" in the Pre-Constructive Rules of Logic are read as within ±10% of the given ratio.

BTC weekly in December 2021 is an example of tolerance. m1 is the decline from $59,177 on November 30 to $42,000 on December 4. The m2 group ran through five monowaves to end at $52,088 on December 27, confirmed when price broke below $42,000 on January 7, 2022.
- m2/m1: 58.7%. Read literally, the table gives Rule 2; read with tolerance, Rule 3.
- m0/m1: 34.5%, so Condition a. It is also close to Condition b's boundary of 38.2%.
- Notation: write R-3a, read with tolerance. Since both boundaries are close, we also check the R-2a, R-3b and R-2b paragraphs.
Time is different: the time taken to retrace a prior wave is counted exactly as written, with no tolerance. For a sentence like "m2 retraced m1 in the time m1 took to form (+1 time unit) or less", compare the number of units m1 took plus 1 with the number of units m2 took to retrace m1 completely. A unit is the point spacing of the chart on which the wave was defined.
The February–March 2021 example above was defined on the weekly wave chart, so count in that chart's point spacing.
- m1: 2 steps
- First point beyond the m1 starting price: March 13, 4 steps after the end of m1
- Verdict: 4 is greater than 2+1, so the sentence is false.
Count the same stretch in weeks and m1 takes one week, the retracement two, which makes the sentence true. Change the counting unit and the verdict can flip, so for time conditions, also record which chart and spacing you counted with.
The output is a list of :5 and :3 candidates
Working through the rules and conditions gives you candidate structure labels for m1. For example, Rule 1's full list is {:5/(:c3)/(x:c3)/[:sL3]/[:s5]}, and Rule 2's is {:5/(:sL3)/[:c3]/[:s5]}. Labels in parentheses are less likely candidates, and labels in square brackets are very rare candidates. If m1 is the first monowave on the chart, or nothing tells you the condition, write the rule's entire list at the end of m1. Some paragraphs tell you to write labels at the end of m0 or m2 instead of m1.
The lists for Rules 1 and 2 start with :5, and the lists for Rules 3, 4 and 5 start with :F3 or :c3, like Rule 4 Condition c's {:c3/(:F3)/(x:c3)}. Rules 6 and 7 have no list in the book's table of contents. Either way, the list still holds several labels. The meaning of position labels such as :F3 and :c3, and how to join them with the labels of neighboring waves to find where a pattern starts and ends, are explained in Part 4.
Below is an example trade plan, separate from Neely's pattern rules. Built on the February–March 2026 daily example above, it orders the steps so that a rule number is used only after m2 is confirmed.
- m2 confirmation condition: don't fix the rule number until price gets back above the m1 end of $69,989. In this example it was confirmed by the $70,096 high of the 4 p.m. UTC hourly bar on March 2.
- Rule check: if the confirmed m2 group is above 61.8% and below 100% of m1 (93.1%) and m0/m1 is near the 100% boundary (101.8%), write both R-4b and R-4c as candidates.
- Entry reference price: a price back above the m1 end of $69,989.
- Stop: below the m2 end of $63,030, 9.9% below the entry reference price.
- Invalidation: if price breaks the m1 start of $62,510 before m2 is confirmed, m2 has exceeded 100%. Re-grade it as Rule 5 or higher and drop this plan.
Check two things before writing a rule number
- Boundaries of m2 and m0: check that they were set by the Rule of Observation. Measuring only the first opposing move gave Rule 3 (4 by the literal table) for the February 2021 example and Rule 2 for the February 2026 example. Set by the Rule of Observation, they are Rule 5 and Rule 4, respectively.
- Ratios near a boundary: here, values within 4 percentage points of a boundary, such as 34.5%, 58.7%, 62.8% and 101.8%, weren't assigned to a single rule or condition; we checked both paragraphs.
We computed the Rule of Observation groups here with separate code and didn't apply the Rule of Neutrality, which moves the boundaries of horizontal stretches. Applying it can change boundary prices and times, and the ratios with them. Read prices with tolerance and count time exactly in point spacing, and you'll get the same candidate list every time you revisit the chart. A rebound near 61.8% isn't a reason to buy; use it only as evidence for narrowing down m1's structure.