OptiNod Academy
Monowaves — A wave ends when direction changes
In Neely's method a monowave ends every time price changes direction. We compare monowaves with zigzag-filter lines on real BTC data.
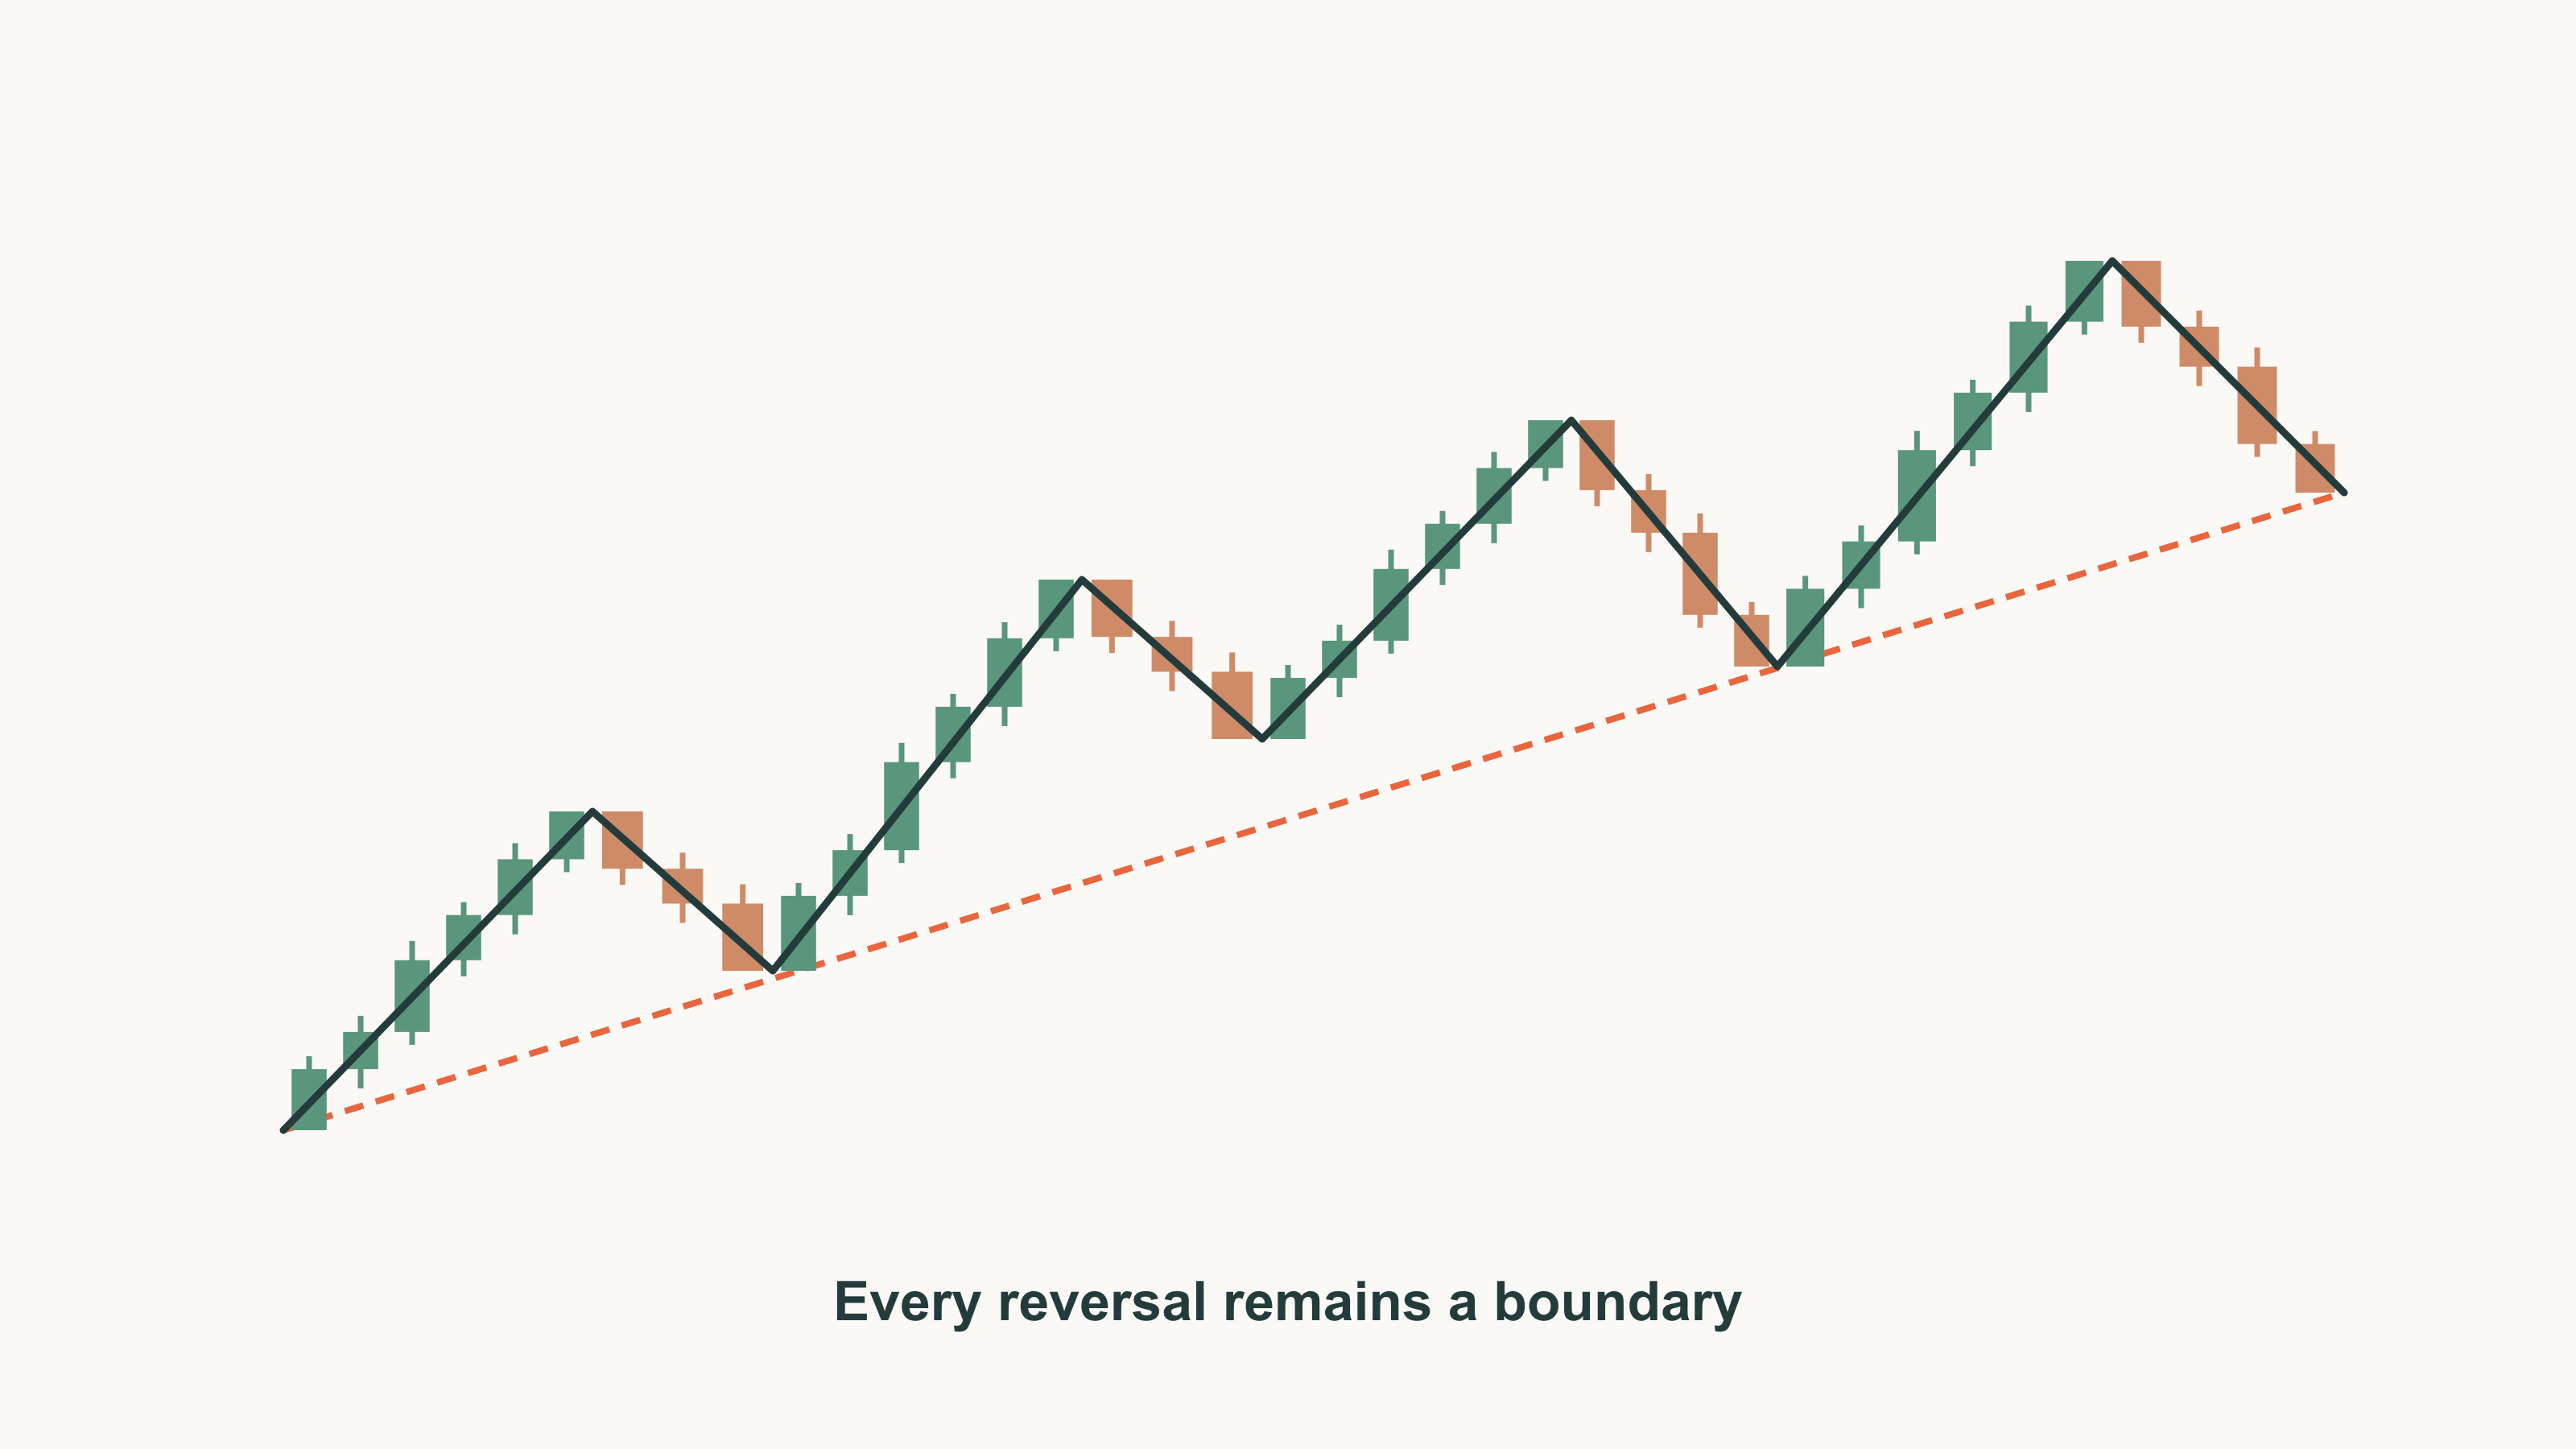
Don't count the legs of an automatic zigzag line as waves. First check which reversals the filter erased.
This series covers NEoWave, Glenn Neely's rule-by-rule restatement of Elliott Wave Theory, starting from the smallest unit: the monowave. By Neely's definition, a monowave ends the moment price changes direction, with no minimum size or duration.
A common way to count waves is to switch on a 5% or ATR-based zigzag indicator and number its vertices 1, 2, 3. Some articles also describe a monowave as "a move that retraces the previous move by at least a certain percentage." Both approaches start counting on a line that has already erased the small reversals.
BTC daily data from July 1 to August 31, 2026 shows how big the gap is. Counted Neely's way, the period has 93 monowaves. A 5% zigzag draws 4 legs over the same period, and a 10% zigzag draws just 1. With starting points that far apart, the wave labels built on top can't describe the same count.

A monowave ends at a change of direction, whatever its size
It's tempting to treat small wiggles as noise and assume waves only appear once a filter such as a 5% zigzag removes them. Neely's monowave has no such threshold. The move from one change of direction to the next is one monowave, with no constraint on price or time. If an advance slows down and then speeds up again without ever turning down, it is one monowave. But the moment a point comes in even slightly below the previous one, the upward monowave ends. In the official Q&A published after his book, Neely also said that "EVERY TURN in price" on a properly drawn cash chart is a monowave, and he set no minimum width or percentage.
Take the BTC advance from 6 a.m. UTC on August 19, 2026 to 8 a.m. on August 21. A zigzag line draws it as one straight leg; the daily wave chart shows five monowaves.
| Monowave | Price | Change |
|---|---|---|
| 1 up | $64,166 → $70,000 | 9.09% |
| 2 down | $70,000 → $68,902 | 1.57% |
| 3 up | $68,902 → $73,400 | 6.53% |
| 4 down | $73,400 → $73,027 | 0.51% |
| 5 up | $73,027 → $79,500 | 8.86% |
| Total | $64,166 → $79,500 | 23.90% |
The fourth monowave lasted under an hour and retraced only 8.3% of the preceding $4,498 rise. Direction changed, so it still counts. July and August hold several small monowaves like this.
- Monowaves under 1%: 12
- Smallest monowave: a 0.28% decline from $64,475 on July 25 to $64,294 on July 26

Small reversals matter because the later rules judge monowaves by their price and time relative to each other. Erase the 0.51% decline and the advances on either side merge into one, which changes what gets compared later. Before dropping a reversal for being small, check how it will be used in those comparisons.
A zigzag filter line is what remains after small reversals are erased
Once you settle on a filter setting, its line starts to look like the wave boundaries. But change the setting and the line changes with it. A percentage zigzag accepts a reversal only after price moves back from an extreme by at least the chosen percentage, and an ATR zigzag only after it moves back by some multiple of ATR. Reversals that fall short vanish from the line. Neely's monowave has no such threshold, so a leg of a filter line can't be treated as a monowave.
On the same BTC daily data for July–August 2026, changing only the setting gives these leg counts.
| Setting | Legs |
|---|---|
| No filter (monowaves) | 93 |
| 5% zigzag | 4 |
| 10% zigzag | 1 |
| 1× prior 14-day ATR | 24 |
| 2× prior 14-day ATR | 5 |
| 3× prior 14-day ATR | 3 |
An ATR setting also shifts with the date. Daily ATR was $2,191 on July 1 and $1,635 on August 21, so the same multiple erases moves of different sizes.
Some of the erased declines came very close to the threshold, and one erased stretch held 15 monowaves.
- 5% zigzag: draws the move from $62,275 on August 1 to $81,479 on August 28 as one up leg. The 4.97% decline inside it, from $79,500 on August 21 to $75,546 on August 23, vanished because it fell 0.03 percentage points short of the threshold.
- 10% zigzag: also erases the 6.99% decline over 11.2 days from $66,956 on July 21 to $62,275 on August 1. That stretch alone contains 15 monowaves.
Defining a monowave as "a move that retraces the previous move by at least a certain percentage" is the same kind of filter. Neely uses ratios only after every monowave has been counted. Measuring how much of one monowave the next one retraces, to narrow down the structure of the first, is the procedure called the retracement rules (Part 3). The 0.51% decline above is also recorded as a monowave that retraced 8.3% of the preceding rise, and that 8.3% is the value that goes into the retracement rules.
If you do use a filter line, don't copy it into your wave count. Keep the monowave record for the same period beside it and mark the erased reversals, largest first; you'll see at a glance where the counts diverge.
Monowaves combine into polywaves, multiwaves and macrowaves
Some traders call any five visible monowaves an impulse or a polywave right away. Neely names waves larger than a monowave as follows.
- Polywave: a wave made of 3 or 5 monowaves
- Multiwave: a wave made of 3 or 5 polywaves
- Macrowave: a wave made of 3 or 5 multiwaves. Every wave larger than that is also called a macrowave.
Over a short stretch, an entire impulse can be a single monowave. Polywave, multiwave and macrowave aren't names you assign just because the count fits; the monowaves have to form a valid pattern. Nor is degree set by a fixed size such as one week or $100. How to determine degree is explained in Part 5.
The August 19–21 advance also contains five monowaves. Whether it's a polywave or an impulse is decided only after applying the retracement rules and the structure labels of Part 4 (:5 for an impulse, :3 for a correction). Don't decide in advance that daily moves are polywaves and weekly moves are multiwaves.
Flat stretches can move the end of a monowave
A stretch where price moves almost sideways is easy to dismiss as consolidation. Here the Rule of Neutrality applies: it can move the end of a monowave, first set by a change of direction, because of a horizontal stretch. Two identical prices in a row form a perfectly horizontal segment, and a move flatter than a 45° line drawn from its starting point is treated as nearly horizontal.
- Situation 1: if the horizontal stretch lies between two monowaves of opposite direction, move the end of the earlier monowave to the right end of the horizontal stretch. Apply this even if the relocated end is slightly below the high.
- Situation 2: if the horizontal stretch lies between two monowaves of the same direction, treat the whole thing as one monowave or split it into three. If the horizontal stretch lasts longer than one time unit, it must be split into three parts.
- Exceptions: do not move the end if price exceeds the earlier extreme again before retracing 61.8% of the earlier monowave. Also do not use Situation 1 if the relocated end would retrace more than 38.2% of the earlier monowave.
BTC has a Situation 1 candidate in early July 2025.
- Horizontal stretch: the highs at 9 p.m. UTC on July 6 and 3 a.m. on July 7 are both $109,700. The same price twice in a row makes a perfectly horizontal segment, with an advance before it and a decline after.
- Exception check: the following $2,270 decline is 119.5% of the preceding $1,900 advance. No point exceeded $109,700 again before 61.8% was retraced, and the relocated end is at the same price, so neither exception applies.
- Hourly chart: between the two points, price dipped to $108,680 at 1 a.m. on July 7 and came back. This dip doesn't appear among the daily wave chart's points.
Neely counts time in the chart's time unit; in this series, one step between wave-chart points is one time unit. Moving the end changes the durations of the advance and the decline as follows.
| Item | Before moving the end | Situation 1 applied |
|---|---|---|
| Up monowave | 1 step | 2 steps |
| Down monowave | 3 steps | 2 steps |
| Decline time ÷ advance time | 3.0× | 1.0× |
| For reference: ratio by actual clock time | 2.64× | 1.35× |
In early August 2026 there is a nearly horizontal candidate.
- Candidate stretch: the point after $65,025 at 8 p.m. on August 5 is $64,999 at 8 a.m. on August 6. Price fell $26, or 0.04%, over one step between points.
- Hourly chart: in between, price dipped to $64,439 and came back.
- Exception check: even if the end is moved to $64,999, it retraces only 2.3% of the preceding $1,145 advance, so the 38.2% exception does not apply.
Whether this stretch is flatter than 45°, however, has to be measured on a chart drawn to the Rule of Proportion, which sets the chart's price and time scales.
- Directional moves: set the scale so they follow the diagonal of a square, about 45°. The tolerance is within 25% of one side.
- Sideways moves: draw them so the range is about 50% of the square's height.
We don't assume a charting program's auto-scaling follows this rule, so we don't judge 45° by eyeballing the slope on screen.

The measuring tool used in this series doesn't apply the Rule of Neutrality automatically. Change one endpoint and every later calculation changes, just as the time ratio went from 3.0× to 1.0×. So whenever we hit a horizontal stretch, we note beside the numbers whether the Rule of Neutrality was applied.
A filter line and monowaves give different stop distances
One common method puts the stop at the zigzag line's last low. That ignores any monowave lows between that low and the entry price.
Below is an example trade plan, separate from Neely's pattern rules. It shows how much the stop distance changes when you set the stop from the monowave record rather than a filter line.
- Entry condition: inside a 5% zigzag up leg, a down monowave retraces less than 50% of the preceding up monowave and turns back up. The stretch on August 19–20, 2026 qualifies: price rose from $64,166 to $70,000 and then retraced 18.8% to $68,902.
- Entry: buy when price exceeds $70,000, where the decline began. It did so on the 7 a.m. UTC hourly bar on August 20.
- Stop: below $68,902, the end of the down monowave. That is 1.57% from the entry price. Using the last 5% zigzag low at $62,275 as the stop from the same spot gives an 11.0% distance.
- Invalidation: even before the stop, abandon this plan if the next down monowave retraces 100% or more of the preceding up monowave. In this case the next decline was 8.3% of the preceding $4,498 advance.
For the same entry, stops of 1.57% and 11.0% differ by 7.0×, and with the same loss limit, so does position size. Before basing a stop on a filter-line low, check whether it erased any monowave lows in between.
Check two things before recording monowaves
- Order of high and low: for each bar, check whether the high or the low came first. Each daily bar makes two points, and if their order flips, the monowave boundaries change too. The examples here take the order from hourly bars, and every point in the July–August 2026 stretch could be ordered. How to set the order, and why to use cash data, is explained in Part 2.
- Chart unit: the number of monowaves depends on the chart unit used to count them. Neely suggests about 60 data points for your first chart. Choosing a price and time unit also decides which waves you'll see and which you won't.
On hourly bars, both horizontal stretches above also contained declines that the daily wave chart doesn't show. So the 93 monowaves from the daily wave chart aren't the market's only possible count. Note which chart unit you counted on and where you applied the Rule of Neutrality, so the retracement rules in Part 3 can be applied on the same basis.