OptiNod Academy
Why is Bitcoin quiet on weekends?
Institutions taking the weekend off, time with family and the CME being closed are often given as reasons for Bitcoin's quiet weekends. We checked each one against 2014–2026 prices and volume.
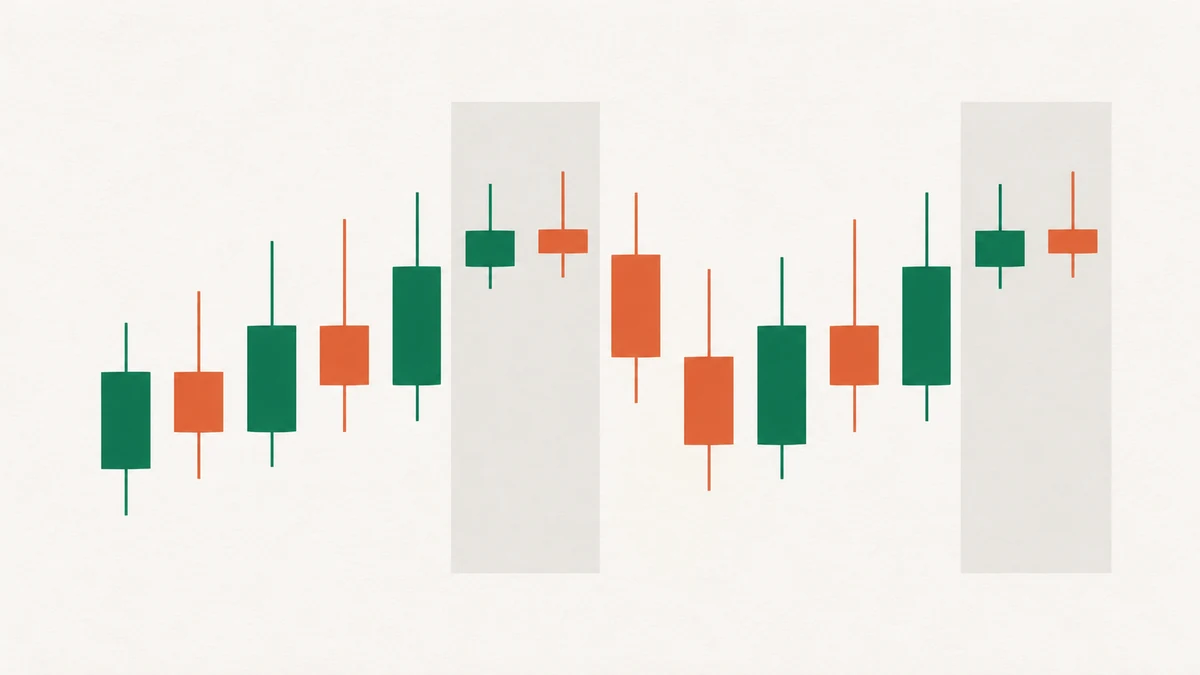
As recently as 2016, Bitcoin moved as much on weekends as on weekdays. Today it moves about half as much as on weekdays. What changed?
Bitcoin trades without a break on weekends too.
Yet on the chart, the candles become noticeably smaller on Saturdays and Sundays. Since 2024, the daily move on weekends has been about half that of weekdays.
There are many explanations: institutions are off, professional traders are off, everyone goes out with their families on weekends, or the CME (Chicago Mercantile Exchange) futures market is closed.
But in 2016, weekend and weekday moves were almost the same. People took weekends off back then too.
The short answer: Bitcoin has come to move on the US stock market's schedule.
When economic data comes out and the stock market opens on weekday mornings in New York, Bitcoin also makes large moves. On weekends there is no such schedule.
We will check each explanation one by one using Bitcoin prices and volume from 2014 to 2026.

The gray shading marks Saturdays and Sundays.
On the left is October–November 2016, with a weekend/weekday ratio of 0.928.
On the right is April–May 2024, with a weekend/weekday ratio of 0.479.
In both cases, these are the two months closest to that year's annual ratio.
Both panels use the same % scale, so candle heights can be compared directly.
Weekends were not always quiet
For each year, the weekend daily move was compared with the weekday daily move as a ratio.
Volume is listed alongside in the same way.
| Year | Weekend/weekday move ratio | Weekend/weekday volume ratio |
|---|---|---|
| 2015 | 0.954 | — |
| 2016 | 0.990 | — |
| 2017 | 0.777 | — |
| 2018 | 0.689 | 0.786 |
| 2019 | 0.810 | 0.792 |
| 2020 | 0.703 | 0.711 |
| 2021 | 0.603 | 0.779 |
| 2022 | 0.568 | 0.593 |
| 2023 | 0.471 | 0.619 |
| 2024 | 0.500 | 0.468 |
| 2025 | 0.629 | 0.517 |
| 2026 | 0.555 | 0.546 |
- Daily move: The absolute value of the percentage change from the previous close to that day's close. Up days and down days are not distinguished.
- Move ratio: The average weekend move divided by the average weekday move. A value of 1 means they are equal, and 0.5 means weekends move half as much as weekdays.
- Data: Prices are Yahoo Bitcoin daily bars (days in UTC), and volume is Binance spot. Figures for 2026 run through October 30.
How much price rose and fell on each day of the week is covered separately in Are Mondays really weak?. This article compares only the size of the moves.
In 2016 there was almost no difference between weekends and weekdays. The ratio started to fall in 2017.
CME Bitcoin futures did not begin trading until the December 18, 2017 trade date (the market opened on the evening of Sunday, December 17, US time). Weekends were already getting quieter before CME futures appeared.
After that, the ratio fell with ups and downs, to 0.471 in 2023 and 0.500 in 2024.
Since January 11, 2024, when spot Bitcoin ETFs (Exchange Traded Funds) began trading in the US, it has been 0.560.
This article calls the period from January 11, 2024 onward the "spot ETF era".
The period from December 18, 2017, the first trading day of CME futures, to January 10, 2024 is called the "CME era".
Quiet weekends are a change that came after 2017.
On weekdays, Bitcoin moves most in the New York morning
Even on weekdays, Bitcoin did not move evenly throughout the day.
When Binance 1-hour bars since 2018 are split by New York time, the hour with the largest weekday move was 10–11 a.m. New York time. The average move in this hour is 0.649%.
On Saturdays, the move in any given hour was between 0.262% and 0.366%.

On the left is Wednesday, March 18, 2026.
On the right is Saturday, March 21, 2026.
The gray shading marks 8–10 a.m. New York time.
The 8:30 a.m. data releases and the 9:30 a.m. stock market open fall inside this shading.
These are the Wednesday and Saturday of the week closest to the spot ETF era average.
Both panels use the same % scale, so candle heights can be compared directly.
For each period, the hourly move from 9 to 11 a.m. New York time was compared with the average hourly move across all 24 hours of the day. A value of 1× means it equals the daily average.
| Period | Weekdays | Saturdays |
|---|---|---|
| 2018–2019 | 1.136× | 1.002× |
| 2020 to before spot ETFs | 1.312× | 0.978× |
| Spot ETF era | 1.764× | 1.041× |
The weekday morning multiple grew from 1.136 times to 1.764 times. On Saturdays it stayed close to 1 in all three periods.
US market events are concentrated in that window.
- US employment and inflation data releases: 8:30 a.m. New York time. In UTC, that is 12:30 during daylight saving time and 13:30 otherwise.
- US stock market regular session open: 9:30 a.m. New York time. In UTC, that is 13:30 during daylight saving time and 14:30 otherwise.
At the same hours on Saturday, there are no such events.
Weekday mornings in New York are now when Bitcoin moves the most during the day.
When only the US stock market is closed, Bitcoin moves as it does on weekends
Bitcoin also trades on weekdays when the US stock market is closed. These are weekdays with only the US market schedule missing.
Moves on Monday-to-Friday days when only the US stock market was closed, such as Martin Luther King Jr. Day or Thanksgiving, were compared separately. Christmas and January 1 were excluded because most other countries' markets are also closed on those days.
| Period | Weekdays with only the US stock market closed | Weekends |
|---|---|---|
| CME era | 0.883× | 0.652× |
| Spot ETF era | 0.584× | 0.552× |
The numbers in the table are multiples, with the daily move on weekdays when the US stock market was open set to 1.
In the spot ETF era there were 24 weekdays when only the US stock market was closed, and on those days Bitcoin moved only 0.584 times as much as on regular weekdays. That is almost the same as the weekend's 0.552 times.

On the left is Wednesday, November 27, 2024, when the US stock market was open.
On the right is Thursday, November 28, 2024, when only the US stock market was closed for Thanksgiving.
The gray shading marks 8–10 a.m. New York time.
Among holidays in the spot ETF era, this is the one where the holiday and the trading day just before it each moved closest to their respective averages.
Both panels use the same % scale, so candle heights can be compared directly.
The CME era was different. Weekdays when only the US stock market was closed moved 0.883 times as much as regular weekdays, close to a normal weekday.
Now, when only the US stock market is closed, Bitcoin is as quiet as on a weekend.
When stocks make large moves, Bitcoin moves more too
Did Bitcoin also make large moves on days when US stocks did? The same-day moves of SPY, the S&P 500 ETF, and Bitcoin were compared.
Days when SPY moved 0.161% or less were treated as quiet days. These are the bottom 20% of the full period.
Days of 1.135% or more were treated as large-move days, the top 20%.
| Period | Quiet SPY days | Large SPY move days |
|---|---|---|
| Before CME | 2.514% | 2.585% |
| CME era | 2.540% | 3.177% |
| Spot ETF era | 2.049% | 2.824% |
The numbers in the table are Bitcoin's average daily move on those days.
Before CME, Bitcoin's move on days when SPY moved a lot was 1.028 times the quiet-day figure, almost the same. It grew to 1.251 times in the CME era and 1.378 times in the spot ETF era.
Today, Bitcoin makes large moves along with US stocks on the days they move a lot.
The degree to which two assets move together like this is called correlation.
On weekends, when the US stock market is closed, there are no such days.
Weekends stayed quiet even after CME opened on weekends
One explanation is that Bitcoin is quiet because CME is closed on weekends.
When the spot price moved over a weekend while CME was closed, a gap formed on the CME futures chart.
But since May 29, 2026, CME has traded Bitcoin futures on weekends too. Did Bitcoin's weekends get busier after weekend trading opened?
Weekends tend to get quieter every year in summer and autumn, so the comparison was made side by side with the same months of 2025.
| Period | Weekend/weekday move ratio |
|---|---|
| January–May 2025 | 0.744 |
| June–October 2025 | 0.581 |
| January–May 2026 (CME closed on weekends) | 0.671 |
| June–October 2026 (CME trading on weekends) | 0.426 |
Both years were split at May 29.
In 2025, the ratio fell from 0.744 to 0.581 after May 29. In 2026, when CME opened on weekends, it fell from 0.671 to 0.426.
Even with CME open on weekends, Bitcoin's weekends did not get busier.
The pickup in moves on Sunday evening also remained.
Sunday at 6 p.m. New York time is when CME used to reopen trading after its weekend close. In UTC, that is 22:00 during daylight saving time and 23:00 otherwise, and in Tokyo it is 7–8 a.m. on Monday.
The move in this hour was 2.97 times the Sunday daytime average in January–May 2026, when CME was closed on weekends.
It was still 2.8 times in June–October, after weekend trading opened.
Even with CME open all weekend, Bitcoin starts moving more again on Sunday evening, when Monday morning begins in Asia.

On the left is March 15, 2026, when CME was closed on weekends.
On the right is June 28, 2026, when CME traded on weekends.
The gray shading marks 6 p.m. New York time.
This bar moved the most of any bar since 8 a.m. on 13 of 21 Sundays in January–May and on 10 of 21 Sundays in June–October.
Among those Sundays, these are the days whose daytime and 6 p.m. moves were closest to the period averages.
Both panels use the same % scale, so candle heights can be compared directly.
Volume is also half on weekends
The amount of Bitcoin traded on weekends also fell. The right-hand column of the first table is the weekend/weekday volume ratio for Binance spot.
It was 0.786 in 2018 and fell as low as 0.468 in 2024.
By era, it was 0.677 in the CME era and 0.503 in the spot ETF era.
The price moves come from Yahoo data and the volume from Binance data. In these two separate sources, weekend moves and volume both fell by close to half.
Today's weekend is a market with only about half of the trading that takes place on weekdays.
Common explanations, checked against the data
The explanations often given for quiet weekends were checked one by one against the results above.
| Explanation | What the data showed | Verdict |
|---|---|---|
| Everyone goes out with their families on weekends | People took weekends off in 2016 too, but that year's weekend/weekday ratio was 0.990. | It does not explain today's quiet weekends. |
| Institutions and professional traders are off | In the spot ETF era, weekdays when only the US stock market was closed moved 0.584 times as much as regular weekdays, similar to weekends. | Partly right. The ones taking time off are institutions and traders who work on US market hours. |
| The CME futures market is closed | The ratio started falling in 2017, before CME futures existed, and weekends stayed quiet even after weekend trading opened in 2026. | It does not fit. |
| The US stock market and economic data schedule | Moves grew larger on weekday mornings in New York, and weekdays when only the US stock market was closed were as quiet as weekends. On days when stocks moved a lot, Bitcoin moved a lot too. | This explanation fits the data best. |
The explanation that institutions are off and the explanation that the US market is closed are effectively the same.
A weekday when only the US stock market is closed is, outside the US, mostly an ordinary weekday. Even so, Bitcoin was as quiet as on a weekend.
In the end, what drops out on weekends is money that moves on US market hours.
What to check on weekends and US holidays
Below are the items to check when holding a position over a weekend or a US holiday.
- Weekend positions: Did you set your stop and target distances using weekday ATR (Average True Range)? In the spot ETF era, weekends moved 0.560 times as much as weekdays.
- US stock market holidays: Is it a weekday when only the US stock market is closed? In the spot ETF era, such days moved 0.584 times as much as weekdays.
- Weekday New York mornings: Are you holding a position through the 8:30 a.m. New York data releases and the 9:30 a.m. stock market open? Bitcoin moves most between 9 and 11 a.m. New York time.
- Sunday evening: Are you holding a position past 6 p.m. New York time on Sunday? Moves that stayed small all weekend grow larger from this point.
Targets and stop distances set for weekday moves are wide relative to weekend moves. The same applies to weekdays when only the US stock market is closed.
How to base stop placement on volatility is covered separately.
Weekend patterns change from year to year
How quiet weekends were differed from year to year.
The weekend/weekday ratio was as low as 0.471 in 2023, then rose to 0.629 in 2025. For 2026 through October it is 0.555.
There were also years like 2016, when weekends and weekdays moved almost the same.
If the link to the US market weakens, weekends could again move as much as weekdays.
What has made Bitcoin's weekends quiet today is the US market's schedule.