OptiNod Academy
Are Mondays really weak?
Using 70 years of S&P 500 data, the last 10 years of US and Korean stocks, and Bitcoin daily bars, we checked how returns and moves differed by day of the week.
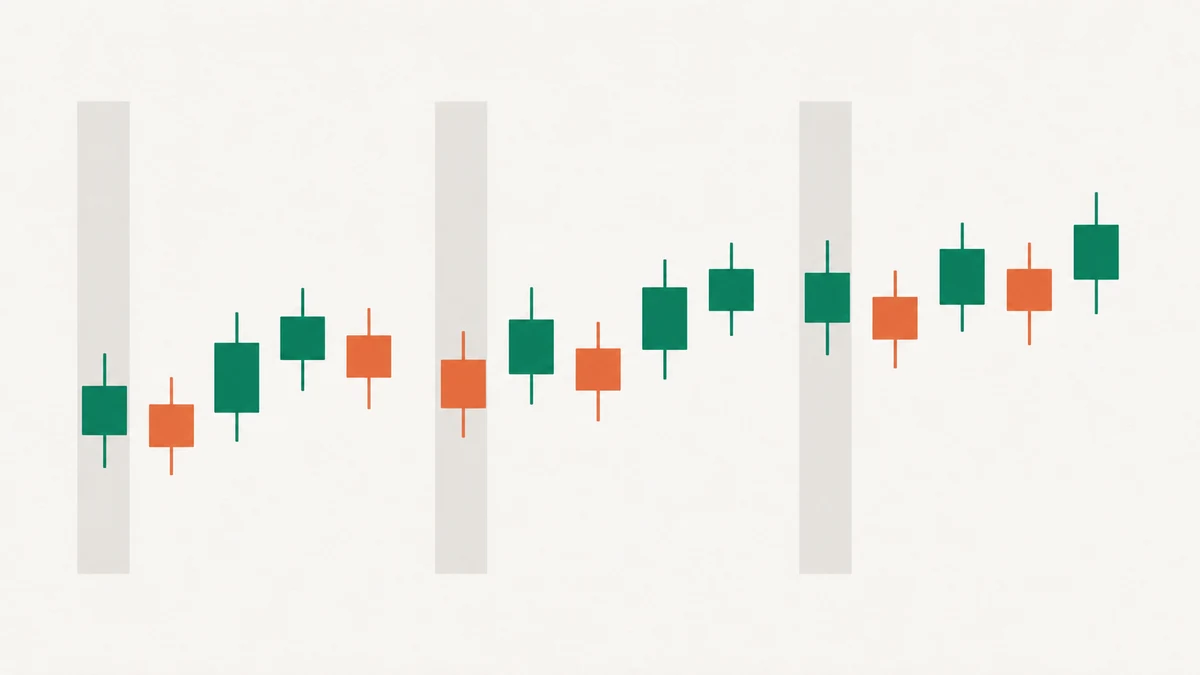
In the US stock market of the 1950s–70s, Mondays fell six times out of ten. Is that still true today?
The Monday effect refers to stock prices being unusually weak on Mondays.
It usually comes with the explanation that bad news piled up over the weekend gets priced in all at once on Monday.
This claim has a basis. In 1980, Kenneth French analyzed S&P 500 daily bars from 1953 to 1977 and published the finding that only Monday had a negative average return.
Rechecking the same period gives the same result. The Monday average was −0.154% and the other days averaged +0.066%, and Mondays fell close to six times out of ten.
From 2016 on, though, the picture changes. The S&P 500 rose on 58.3% of Mondays, more often than on other days (53.6%).
So has the day-of-the-week effect disappeared? Using daily bars of US and Korean stocks and Bitcoin, we will check what changed for each day of the week and what stayed the same.

On the left, in the S&P 500 from September to November 1966, Mondays fell 7 times out of 12.
On the right, in SPY from July to September 2025, Mondays fell 5 times out of 12.
A down day is measured against the previous close, so it can differ from the candle color.
The Monday effect appeared in the 1950s–70s
To see whether Mondays stayed weak after the 1953–1977 period French analyzed, S&P 500 daily bars were split into four periods.
| Period | Monday average | Other days average | Monday up probability | Other days up probability |
|---|---|---|---|---|
| 1953–1977 | −0.154% | +0.066% | 41.3% | 55.0% |
| 1978–1999 | +0.001% | +0.066% | 53.8% | 53.1% |
| 2000–2015 | −0.011% | +0.023% | 51.2% | 53.5% |
| 2016–2026 | +0.075% | +0.050% | 58.3% | 53.6% |
- Average: The average return from the previous close to that day's close. For stocks, the Monday return runs from Friday's close to Monday's close, so it includes the weekend.
- Up probability: The share of days with a return above 0.
From 1953 to 1977, the Monday average was −0.154%, well below the other days (+0.066%). The up probability was also lower, at 41.3% against 55.0% for the other days.
After that, the difference between Monday and the other days gradually narrowed.
From 1978–1999 onward, Monday's up probability was similar to that of the other days.
In 2016–2026, Monday's up probability was 58.3%, in fact higher than the other days.
The idea that Mondays are weak comes from 1950s–70s data.
It does not fit today's market.
Today, weekday differences are small compared with a day's move
Daily bars from 2016 to October 2026 for the US exchange-traded funds SPY and QQQ, the KOSPI index and Samsung Electronics were split by day of the week.
The numbers in the table are average returns by weekday.
| Day | SPY | QQQ | KOSPI | Samsung Electronics |
|---|---|---|---|---|
| Mon | +0.095% | +0.145% | −0.015% | +0.043% |
| Tue | +0.066% | +0.104% | +0.123% | +0.206% |
| Wed | +0.086% | +0.134% | +0.083% | +0.181% |
| Thu | +0.007% | +0.008% | +0.044% | +0.066% |
| Fri | +0.023% | +0.001% | +0.025% | +0.047% |
| Daily standard deviation | 1.117% | 1.400% | 1.501% | 2.197% |
In SPY, the day with the highest average was Monday (+0.095%) and the lowest was Thursday (+0.007%).
The difference between the two is 0.088 percentage points, about 8% of the daily standard deviation of 1.117%.
The standard deviation describes how widely daily returns are spread around the average.
In the other three markets as well, the difference between the best and worst days was 7–10% of the daily standard deviation.
Compared with how much price normally rises and falls in a day, the weekday differences are very small.
In the end, in all four markets the weekday differences were very small compared with a typical day's move.
The best and worst weekdays change from year to year
When SPY from 2016 to 2026 is split into single years, the weekday with the lowest average in each year was spread across all five weekdays.
Friday and Thursday were the lowest 3 times each, Monday and Wednesday 2 times each, and Tuesday once.
Monday, which had the highest overall average, was negative in 2018, 2019 and 2022.
Over the full period, KOSPI's Monday average was −0.015%, the lowest of the five weekdays.
But the Monday average was +0.371% in 2025 and −0.513% in 2026 (through October).
Anyone who looked only at the 2025 result and took Monday as a strong day would have seen the opposite result the following year.
Believing that a result that recently stood out will continue is called recency bias.
With weekday patterns too, looking at only one or two years of data makes it easy to fall into this bias.
Bitcoin moves less on weekends
Bitcoin trades on weekends too, so Saturday and Sunday can be looked at separately.
On weekends the stock market is closed and no major economic data is released, so there is less news to move the price than on weekdays.
Why weekends are quiet is checked separately with data in Why is Bitcoin quiet on weekends?.
This section uses Binance spot BTCUSDT daily bars, with each day starting at 00:00 Coordinated Universal Time (UTC).
If a chart uses a different time zone setting, the hours that fall into the Saturday bar change as well.
Move size is the average of daily returns with the sign removed.
It shows how far the close moved in a day, whether up or down.
| Day | Average return | Up probability | Move size | High−low range |
|---|---|---|---|---|
| Mon | +0.342% | 50.0% | 2.744% | 5.414% |
| Tue | −0.025% | 49.2% | 2.358% | 4.942% |
| Wed | +0.342% | 52.5% | 2.486% | 5.192% |
| Thu | −0.300% | 45.3% | 2.523% | 5.147% |
| Fri | +0.250% | 51.8% | 2.357% | 5.073% |
| Sat | +0.139% | 55.3% | 1.325% | 3.290% |
| Sun | +0.033% | 52.0% | 1.813% | 3.945% |
From 2018 to October 2026, the average weekend move was 1.569%, 0.63 times the weekday figure of 2.493%.
Saturday, at 1.325%, was less than half of Monday's 2.744%.
The difference between the intraday high and low shows the same.
The high−low range was 3.290% on Saturday and 3.945% on Sunday, smaller than on any weekday.

The average weekend move that month was 0.821%.
The weekday figure was 1.25%, so weekends moved 0.66 times as much as weekdays.
In terms of direction, Thursday was the weakest.
The Thursday average was −0.300%, and it was negative in both periods when split into 2018–2020 and 2021–2026.
However, compared with Thursday's daily move size of 2.523%, 0.300% is about one eighth. Even on Thursdays, Bitcoin rose more than four times out of ten (45.3%).
Thursday's weakness is also too small a difference to be a reason to sell.
What clearly differs by day of the week in Bitcoin is the size of the move.
Targets and stop distances set for weekday moves are wide relative to weekend moves.
What to check when looking at days of the week
There are four things to check before using day-of-week figures in trading.
- Size of the difference: Is the weekday difference large compared with a day's move? For SPY today, it is about 8% of the daily standard deviation.
- Era: Does the result come from old data, such as the 1953–1977 S&P 500?
- Year to year: Does the same result appear every year? KOSPI's Monday average was +0.371% in 2025 and −0.513% in 2026.
- Weekend distance: Have you matched the target and stop distance of positions held over the weekend to weekend moves? Bitcoin's weekend move is 0.63 times the weekday move.
Two ways to recheck a weekday difference
Whether a claim that some weekday is strong or weak holds up can be checked in two ways.
Here, SPY's Mondays are used as the example.
The first is whether the same result appears when the period is split in two.
SPY's Monday average was +0.051% in 2016–2020 and +0.133% in 2021–2026. In both the earlier and later periods, Mondays rose on average.
The second is how large the weekday difference is compared with a day's move.
The 0.088 percentage point difference between SPY's Monday and Thursday was about 8% of the daily standard deviation. Compared with how much price rises and falls in a day, it is a very small difference.
The Monday effect of the 1950s–70s passed both checks.
Split into 1953–1965 and 1966–1977, the Monday average was around −0.15% in both.
The 0.22 percentage point difference between Monday and the other days in 1953–1977 was about 30% of that era's daily standard deviation of 0.749%, nearly four times today's SPY figure.
Today's weekday differences are not that distinct.
The differences are too small to decide whether to buy or sell based on the weekday alone.