OptiNod Academy
Structure labels — Finding where a pattern starts and ends from its :5 and :3 sequence
Before numbering waves 1, 2, A or B, write :5 and :3 candidates for each wave and let the label sequence show where a pattern starts and ends. With BTC examples.
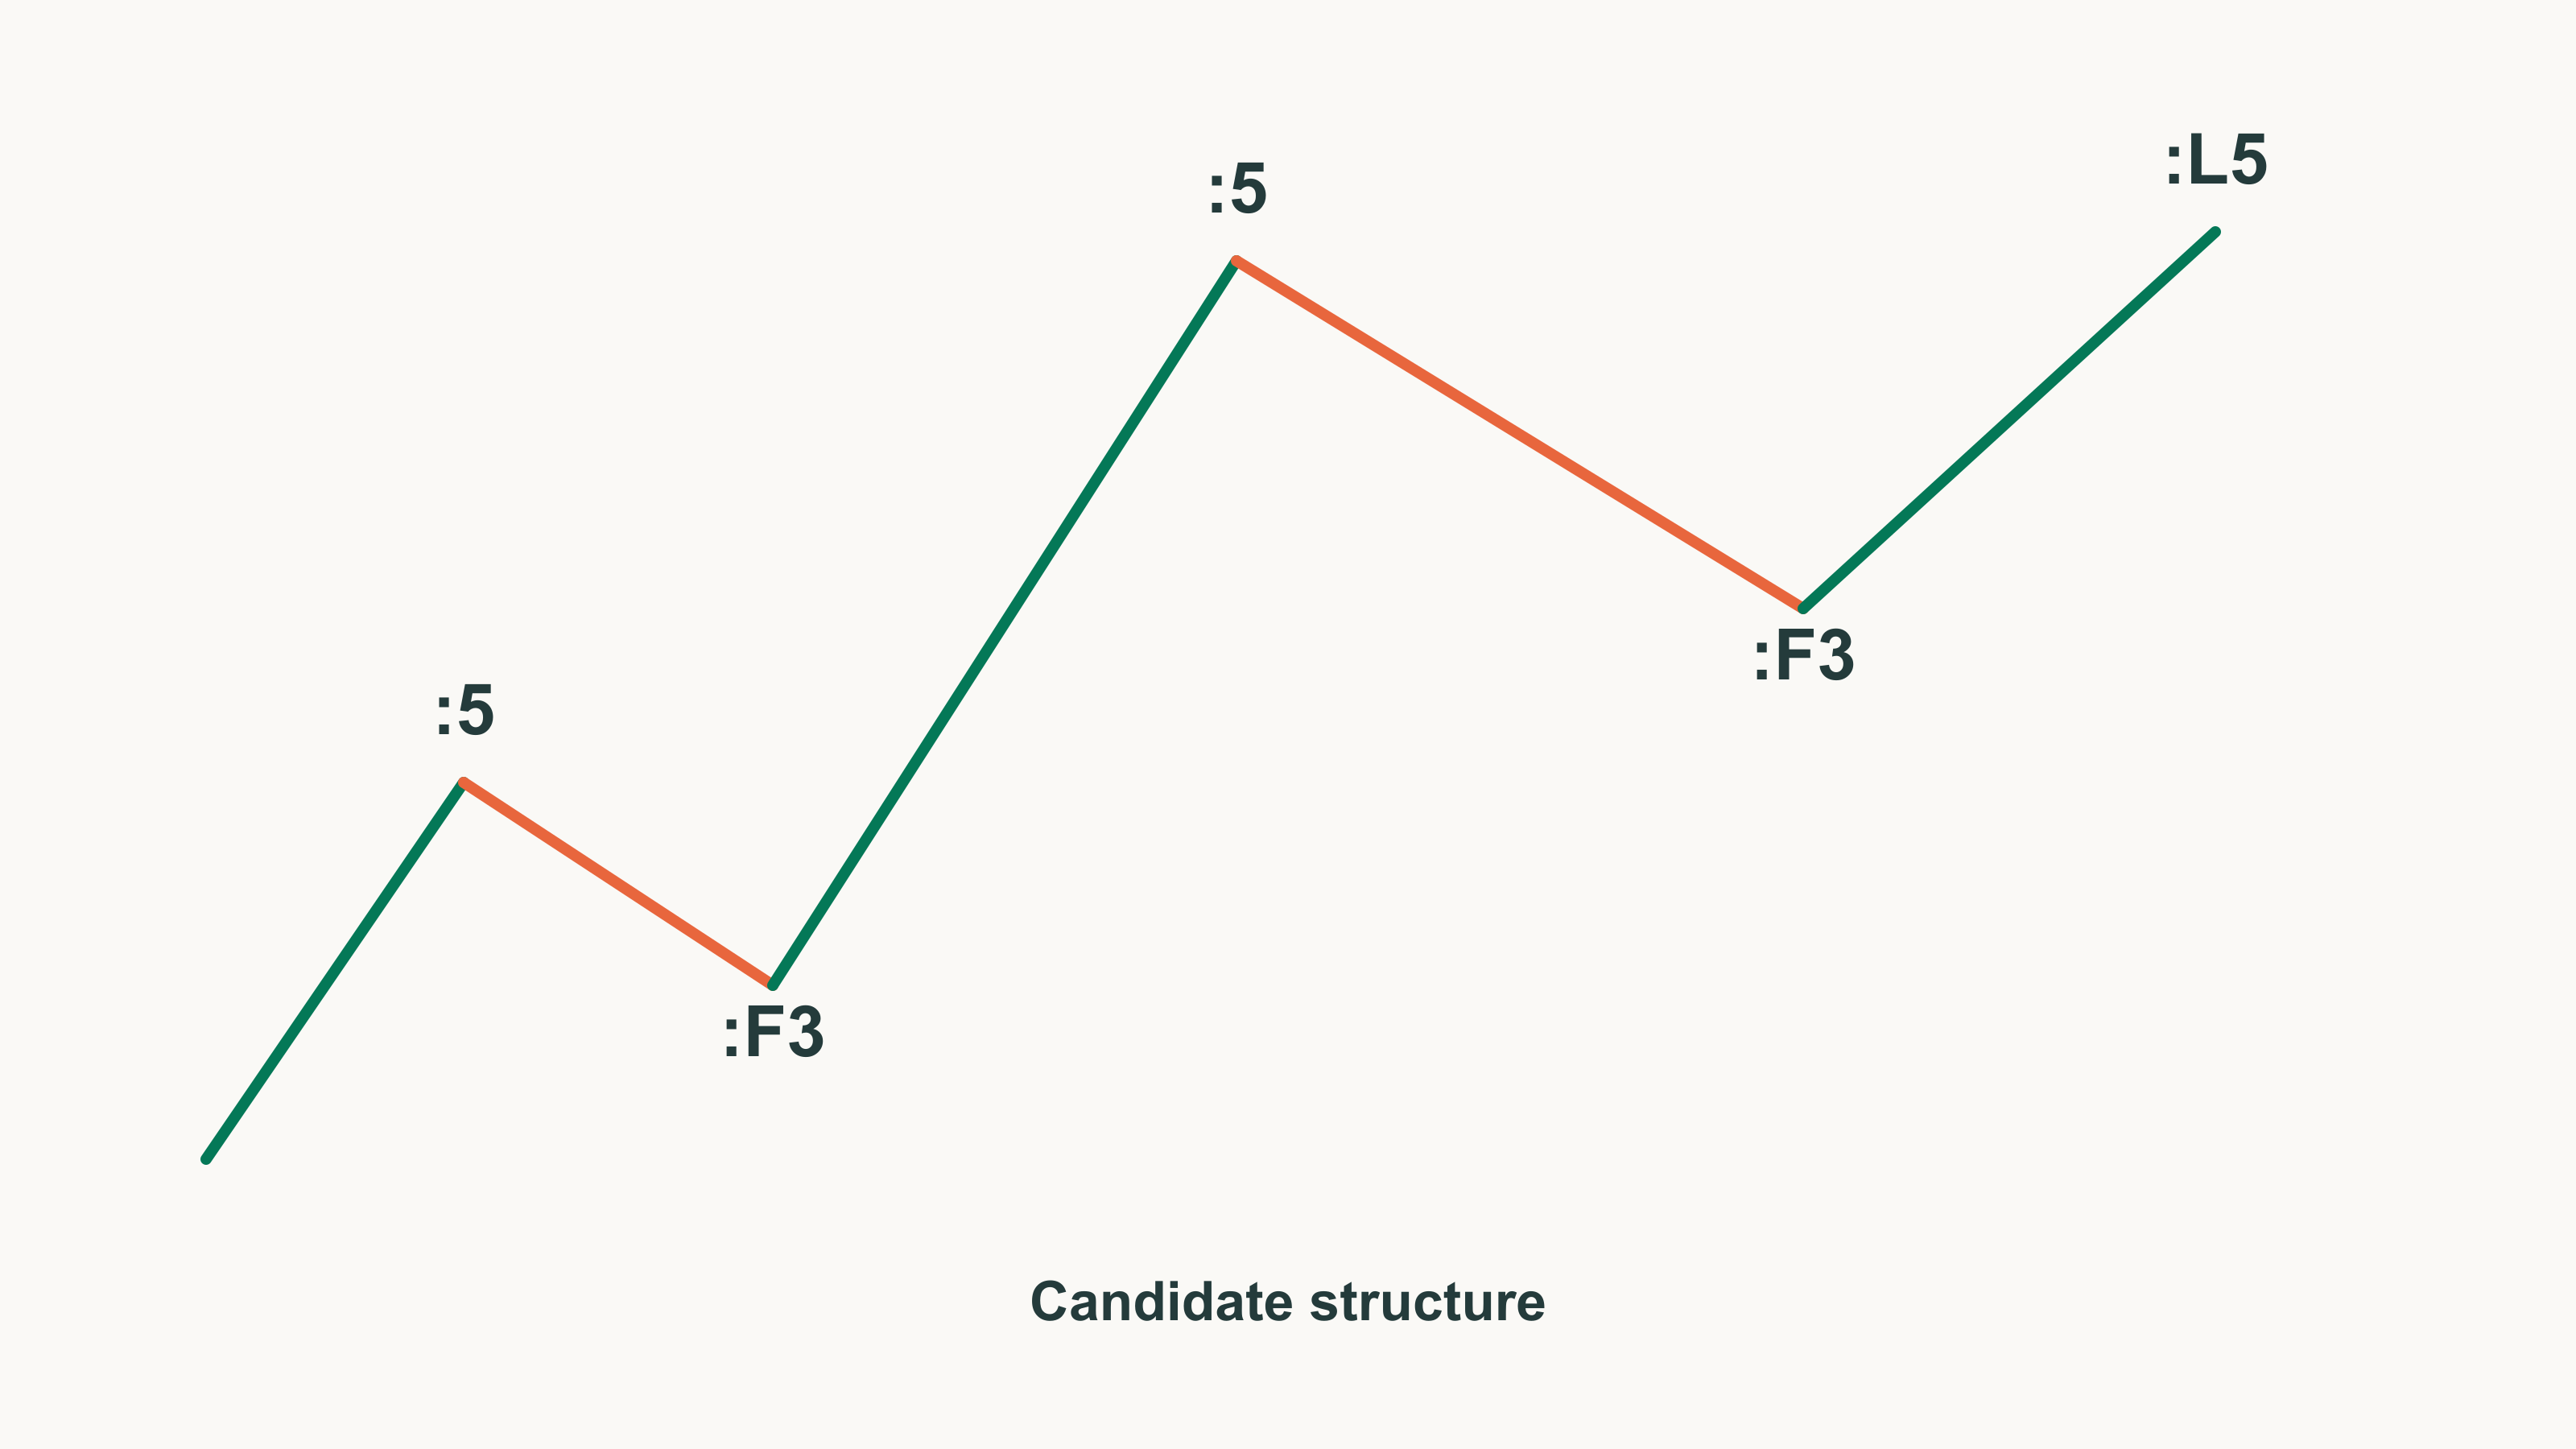
Before numbering waves 1, 2, A or B, find where the pattern starts and ends from its :5 and :3 sequence.
In Part 3, retracement ratios narrowed down the possible structures of the prior wave. Each wave is left with a list of :5 or :3 candidates, some prefixed with letters such as F, c, L or s. Now we link those lists across neighboring waves and group them into a pattern.
Most Elliott counts start by writing 0 at an obvious low and continuing 1, 2, 3. Number first, and when the next wave doesn't go as expected, you end up stretching or squeezing waves to fit the numbers.
Neely assigns progress labels (1–5, A–E) only after a pattern is confirmed. Until then, each wave gets just a structure label and a position indicator. You then look for the pattern's final label (:L5 or :L3) and count backward from it to fix the start.
Structure labels show direction; progress labels show position
Neely divides market movement into two kinds. A move with the trend of the next higher degree is an impulse; a move against it is a correction. Impulses get :5 and corrections get :3. The labels apply equally to a single monowave and to a wave that condenses a months-long pattern.
Progress labels give the order within a pattern. Impulse patterns are numbered 1–5 and corrective patterns lettered A–E; the W, X and Y of complex corrections are covered in Part 12.
The 5 and 3 roughly reflect the number of internal waves. But a triangle is a :3 built 3-3-3-3-3, and a terminal impulse is a :5 built the same way. So don't write :5 or 1–5 the moment you see a move with five turns.
Position indicators record where a :3 or :5 sits within a pattern
Even after the Retracement Rules, a wave can have several candidates left. Under Rules 6 and 7 any structure is possible, so if no condition paragraph fits, choose using position indicators. A position indicator is a letter in front of :3 or :5 that keeps only the candidates able to link with the waves before and after.
- :F3: the first :3 of a pattern. It comes at the head of a pattern, right after an x:c3, or between two :5s. If :F3 appears twice in a row, a new pattern of smaller degree begins at the second :F3.
- :c3: a :3 in the middle of a pattern. It cannot be the start or end of a pattern, and it is not immediately followed by a large, strong directional move.
- x:c3: a :c3 in the x-wave position linking two standard corrections. It must not be more complex than the patterns before and after it.
- :sL3: the second-to-last :3. It is used only when an :L3 comes right after it, and it is the fourth of five consecutive :3s.
- :L3: the last :3. It ends a triangle or terminal made of five :3s, and if it is the smallest of the five it must be completely retraced within the time it took to form.
- :s5: a special :5. It can take the :L5 position but needs no reversal to confirm its end, and the two waves before it must be 5-F3 or F3-c3.
- :L5: the last :5. It always ends a larger pattern, and the label right before it must be :F3 or :c3.
Labels joined by a dash (-) are in the same pattern. A double plus (++) marks the boundary between patterns, and an x-wave goes between two ++.
A pattern name can be given only when the label sequence fits
Each pattern has a fixed structural sequence, and a completed pattern condenses into one label.
| Pattern | Structural sequence | Sequence with position indicators | Label once complete |
|---|---|---|---|
| Trending impulse | 5-3-5-3-5 | 5-F3-5-F3-L5 | :5 |
| Zigzag | 5-3-5 | 5-F3-L5 | :3 |
| Flat | 3-3-5 | F3-c3-L5 | :3 |
| Triangle · terminal impulse | 3-3-3-3-3 | a sequence such as F3-c3-c3-sL3-L3 | triangle :3, terminal :5 |
In these examples, m0 and m2 are set with Part 3's Rule of Observation, and each rule's full list is used (for Rule 4, the per-condition list). Of the condition paragraphs, we applied only the first sentence of Rule 7 Condition d.
Take the advance from February 1 to 21, 2021 on the BTC weekly wave chart: five monowaves rising 80.7%, from $32,296 to $58,353. Between them, the five lists contain every label needed for 5-F3-5-F3-L5.
| Wave | m2/m1 | Rule | Label needed |
|---|---|---|---|
| Wave 1 | 34.3% | 1 | :5 |
| Wave 2 | 395.0% | 7, Condition d | :F3 |
| Wave 3 | 35.3% | 1 | :5 |
| Wave 4 | 309.0% | 7, Condition d | :F3 |
| Wave 5 | 120.1% | 5 | :L5 |
Waves 1 and 3 take the :5 at the head of Rule 1's list. Waves 2 and 4 have m0/m1 of 291.9% and 283.3%, putting them in Condition d. That condition's first sentence compares time, and on this weekly wave chart waves 1–5 each take one step, so they pass and receive :F3. In Part 6, the same advance is counted as just wave 5 of a larger advance candidate that began on January 22.
The position indicators' length conditions pass too.
- Wave 3 ÷ wave 1: 135.3%, at least 38.2%.
- Length of wave 4: $4,137, shorter than wave 3 ($11,719) and wave 5 ($12,782).
- Price zones of waves 2 and 4: $37,989–40,956 and $45,571–49,707, which do not overlap.
It fails the extension rule, though. Wave 5 is 109.1% of the second-longest wave 3 (book standard) and 147.6% of the shortest wave 1 (2006 Q&A standard), both short of 161.8%. By contrast, the daily stretch of June 24–26, 2019 ($10,621 to $13,970) has a fitting sequence and an extension ratio of 270.5%, above the standard. The label sequence is only the first filter; a pattern gets its name after the remaining rules are checked too.

Five turns up do not make an impulse if the label lists do not fit
Judged by shape alone, the March 2023 advance on the BTC daily wave chart looks close to a textbook impulse.
- Stretch: from $19,549 on March 10 to $26,387 on March 14, five monowaves
- Shape: the wave-4 low ($21,814) is above the wave-1 high ($20,687), and wave 5 extended to 191.7% of wave 3.
The candidate lists say otherwise.
- Wave 1: the next wave retraced 81.0%, so Rule 4. The m0 set by the Rule of Observation (three monowaves from $21,835 on March 9) is 201.0% of wave 1, so Condition d, and the list {:F3, (:c3), (x:c3)} has no :5.
- Wave 5: before price exceeded $26,387 again, it retraced 54.4% to $23,897 on March 15, so Rule 2. The list {:5, (:sL3), [:c3], [:s5]} has no :L5, only the very rare candidate :s5.
Since :s5 can take the :L5 position, wave 5 alone can't rule out this sequence. But wave 1's list has no :5, so these five waves can't be grouped as 5-F3-5-F3-L5. Price went on to $28,868 on March 22.

However textbook the shape looks, don't number the waves if the first or last wave's list doesn't fit.
A zigzag is also checked with the 5-F3-L5 sequence and length conditions
Run the same check before labeling a three-leg decline A, B, C. Here's the December 2024 decline on the BTC weekly wave chart.
| Wave | Move | Rule | Label needed |
|---|---|---|---|
| A | Dec 17 108,353 → Dec 20 $92,233 (14.9% decline) | 2 | :5 |
| B | → Dec 26 $99,964 | 5 | :F3 |
| C | → Dec 30 $91,530 | 5 | :L5 |
Wave B retraced 48.0% of wave A, and wave C ended below the end of wave A. All three lists have the labels needed, and the 5-F3-L5 length conditions fit too.
- Length of :F3: wave B ($7,731) is shorter than wave A ($16,121) and wave C ($8,433).
- C ÷ A: 52.3%, at least 38.2%.
If the sequence fits, the three waves condense into a single :3. But a C/A of 52.3% falls in the truncated range, so once it ends, price must retrace at least 81% of the whole zigzag.
- Rebound: stopped at $102,724 on January 7, 2025, 66.5% of the whole.
- Break: on January 9 price broke the end of C at $91,204.
That's why Part 10 doesn't count this stretch as a truncated zigzag.

Had wave B been longer than wave C, the :L5 condition would fail. Then don't group the three waves as a zigzag; look for another sequence.
Find a pattern's start by counting backward from its end (:L5 or :L3)
Don't pick a pattern's start from an obvious low. Pattern isolation works from the end.
- Track the labels wave by wave until an :L5 or :L3 appears, and when it does, draw a circle at the end of that wave.
- From there, count three labels to the left. If the third wave's label is only one of :F3, x:c3, :L3, :s5 or :L5, stop; otherwise move one more wave left.
- If the wave where you stopped is :F3, draw a circle at its start; for any other label, at its end.
- The number of waves between the two circles must be odd. If it is even, search again further to the left.
Apply this to the February 2021 example.
- Three steps left: moving from :L5 (wave 5) through waves 4 and 3 to wave 2, you reach :F3. A circle at the start of wave 2 leaves four waves between, waves 2–5 (even).
- One step further left: wave 1 is :5, so you keep going. The decline before it ($38,532 on January 29 → $32,296 on February 1) is Rule 5, so its list has :F3, :c3, :5, :L5, (:L3).
- Circle position: if this decline is :L5, the circle is drawn at $32,296 and there are five waves between (odd). If it's :F3, the circle moves to $38,532 and there are six, which doesn't work.
So the February advance groups as a five-wave pattern only if the preceding decline ended the previous pattern.
Working from the same end, the lists alone would also allow reading just waves 3, 4 and 5 as 5-F3-L5. Then wave 2, three steps to the left, would have to end with x:c3, :L3, :s5 or :L5. Wave 2 gets :F3 from the first sentence of Condition d, but other sentences of that condition could add x:c3 or :L5, so our calculation doesn't settle it. Pattern isolation is meant for when each wave has a single label left, so we record both readings and group the waves once one candidate is eliminated.
Below is an example trade plan, separate from Neely's pattern rules, using the numbers of a sell plan after the February 2021 advance ended.
- Sequence condition: the lists of the preceding five waves contain :5, :F3, :5, :F3, :L5 in order, and wave 4 ($4,137) is shorter than wave 3 ($11,719) and wave 5 ($12,782).
- End check: price breaks below the 2-4 line joining the end of wave 2 ($37,989) and the end of wave 4 ($45,571) within the deadline. The deadline is 2 steps: the time :L5 took to form (1 step of point spacing) plus one time unit. In 2021 the break came after 1.24 steps, at about $53,584 at 10 a.m. UTC on February 22, 0.6 days after the high in actual time.
- Entry: after confirming the break, sell below the 2-4 line (about $53,584).
- Stop: above the :L5 end of $58,353.
- Exit: when the decline retraces 100% of :L5 and reaches the :L5 start ($45,571), close half. In 2021 it retraced 120.1%, down to $43,000.
- Invalidation: if price exceeds $58,353, stop treating that wave as :L5. An :s5 needs no reversal even in the :L5 position, so reconsider the last label as :s5 or :5.
The extra unit in the deadline is the minimum confirmation standard for :L5. The impulse post-confirmation in Part 8 uses wave 5's formation time as the deadline, and by that standard 1.24 steps is late. One step on the weekly wave chart is half a week, so we re-measure deadlines like this on a lower-level wave chart.
Check three things before judging labels
- Scope of the tool: the monowaves here join each bar's high and low in the order the hourly bars show, without the Rule of Neutrality. Applying it may change the count of short monowaves, such as wave 2 (8 hours) and wave 4 (1 hour) in the June 2019 example.
- Waves that came out as Rule 6 or 7: in a Q&A, Neely compared a :5 and a :3 of the same degree. A :5 completely retraces the preceding monowave in less time than that monowave took to form; a :3 retraces no more than 61.8% of the preceding monowave (usually less) and takes the same time or longer. That describes a tendency, so we use it only as a tiebreaker when comparing candidates.
- The two meanings of 3-3-3-3-3: five :3s in a row can be either a triangle or a terminal impulse. If it follows the essential impulse rules, it's a terminal (Part 7); if not, a triangle (Part 11).
In another Q&A, Neely said this step-by-step procedure is the standard order for beginners, and that once you've learned the concepts you needn't follow every step. We stick to the standard order, writing 1–5 or A–C only when the backward count gives an odd number of waves and the sequence passes the pattern rules. Until then, the chart carries only candidate labels and circles.