OptiNod Academy
Missing waves — keep them as an alternate count only when there's evidence
Neely's missing waves are monowaves that a larger time frame erases. We test the conditions for accepting one, and the clues to emulation, on real BTC data.
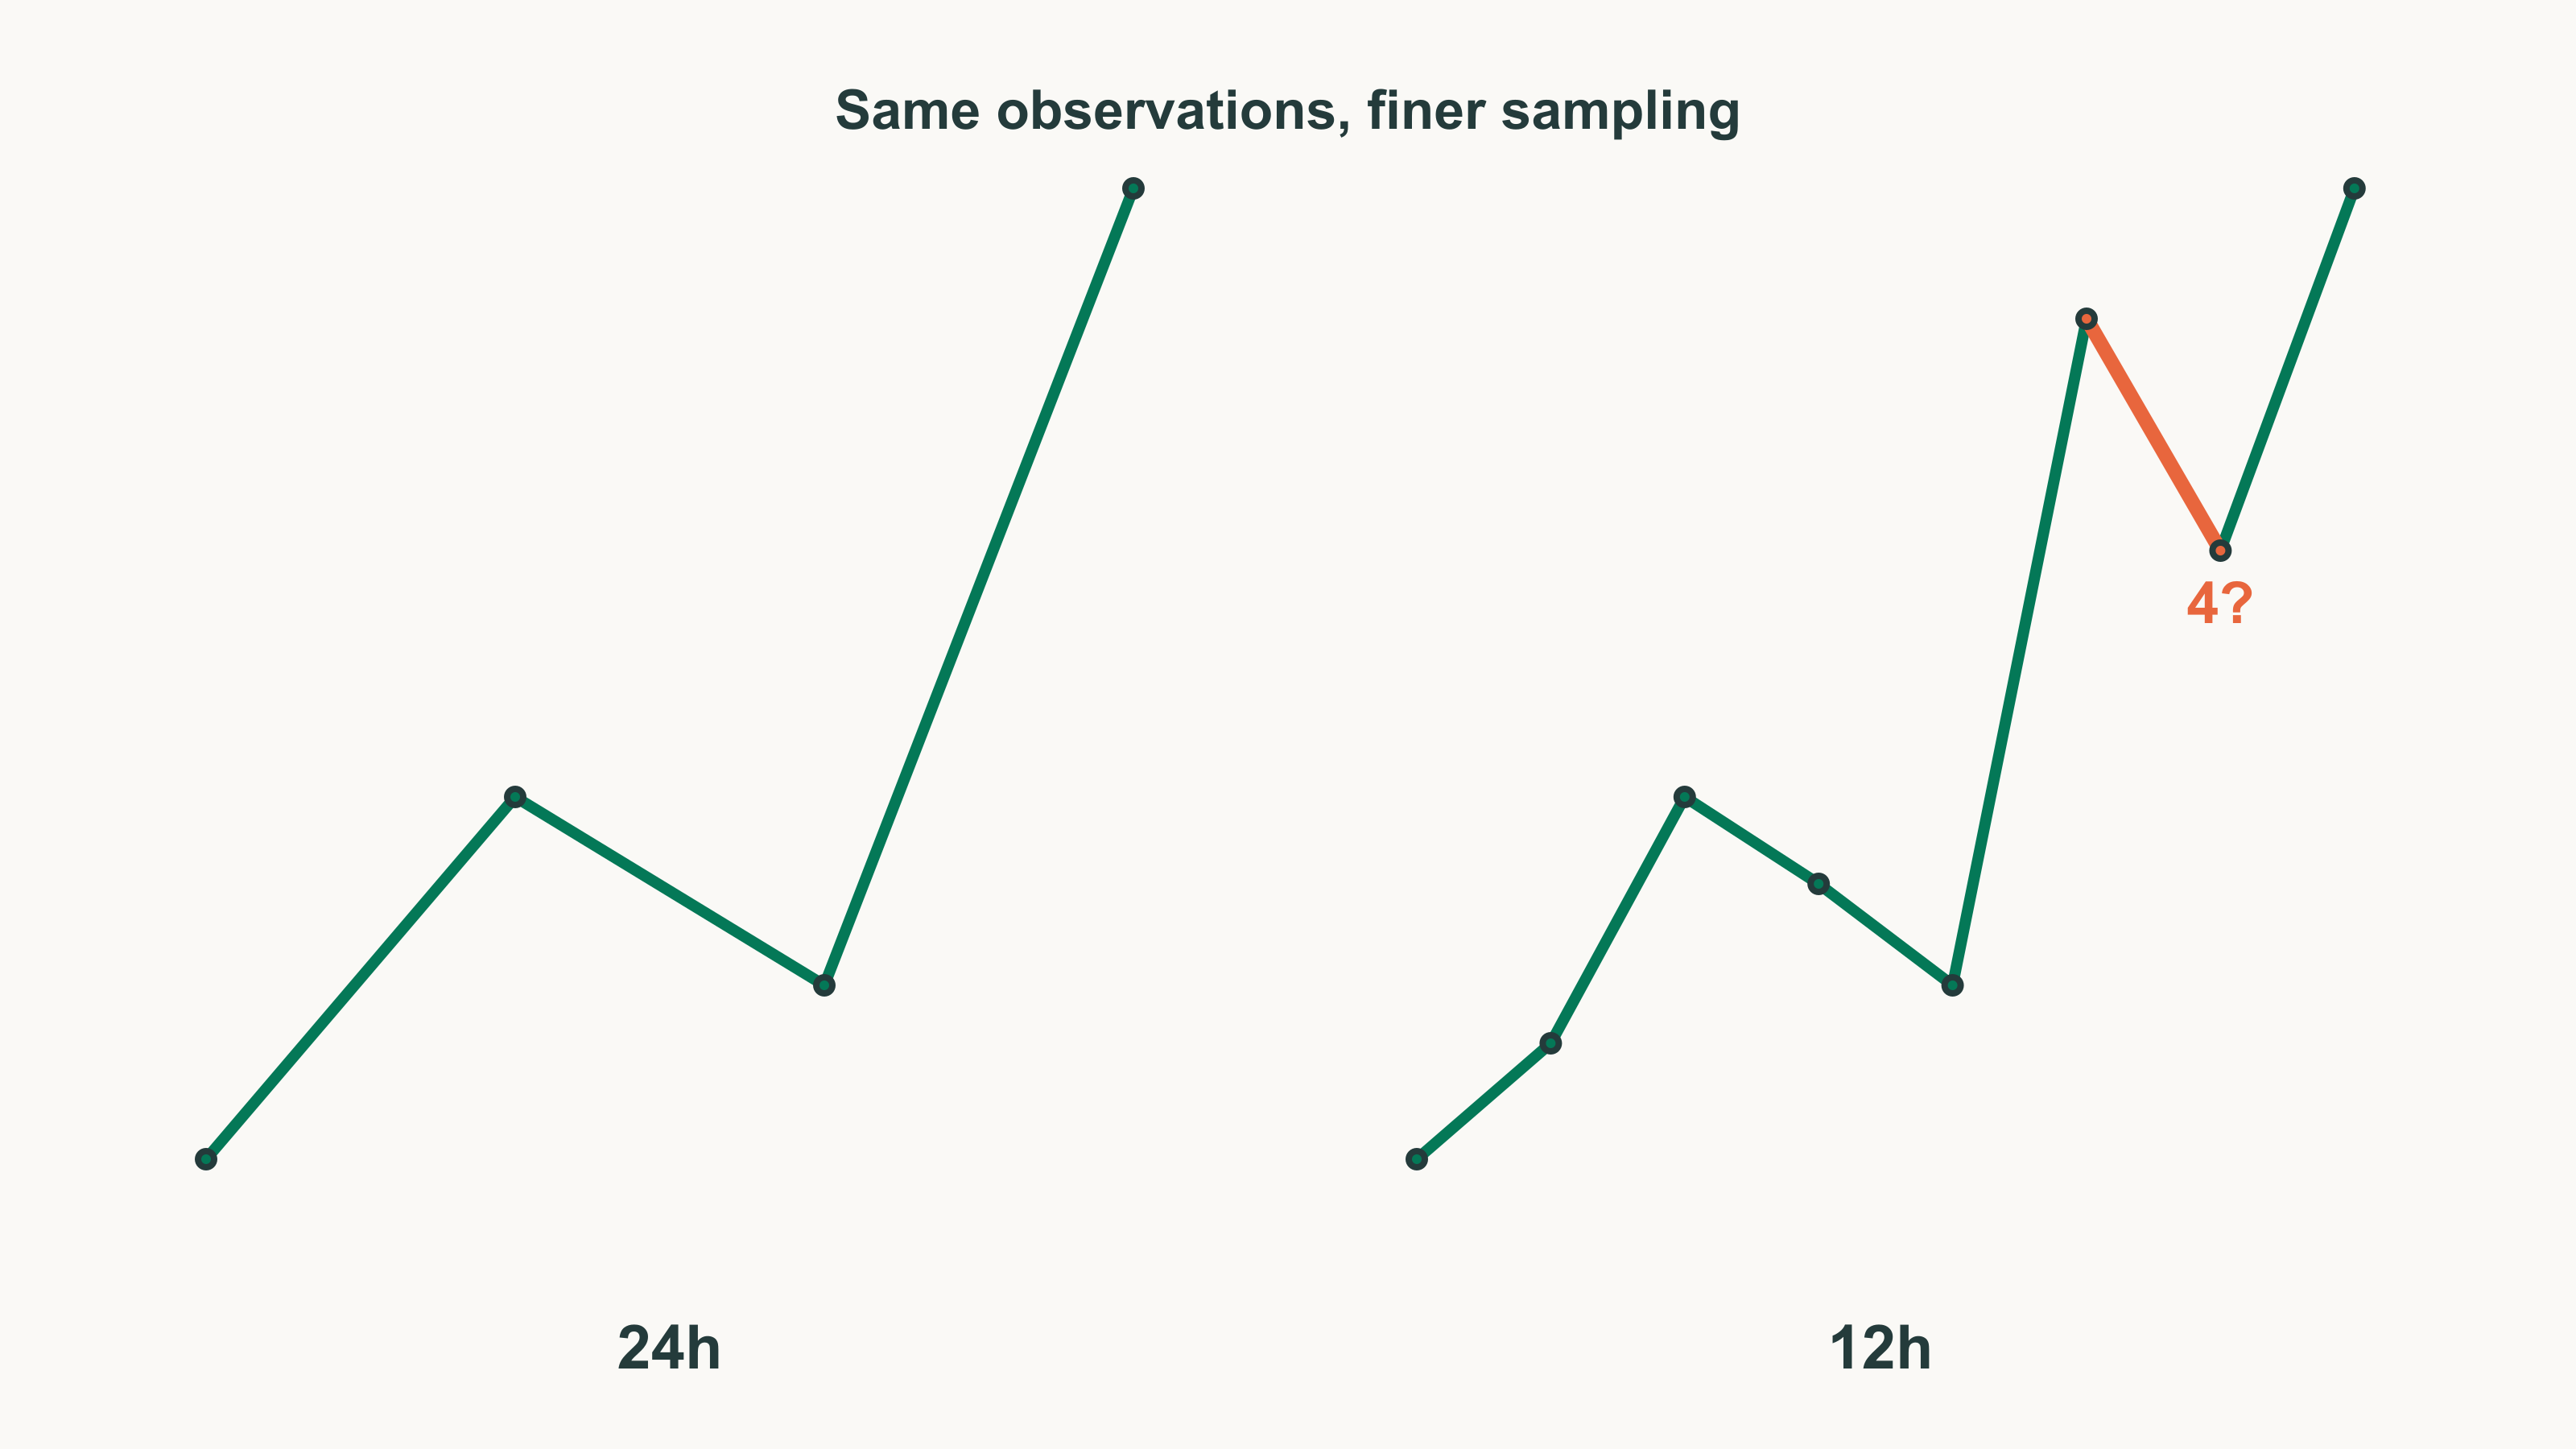
Don't squeeze a missing wave into a count that doesn't fit; keep it as an alternate count only when it actually shows on a lower time frame or the rules require it.
In Part 13, we read structure from which wave crosses a channel line. Now we turn to waves that don't show on the chart at all. Glenn Neely calls a wave missing when it would show on a smaller time frame but disappears between the data points of a larger one.
When a count breaks the rules, some analysts patch it by saying "there's a missing wave here." Do that freely and any chart becomes whatever pattern you want. Neely limited missing waves to specific degrees, pattern types and data-point counts, and outside those limits he doesn't consider them.
Here we recount the same BTC sections on daily, 12-hour, 4-hour and 1-hour bars to see whether the vanished wave really shows on a lower time frame. Then we check separately whether a count that includes that wave passes the rules.
A missing wave is a monowave that vanished on the larger time frame
An advance that moved three times on the daily chart is easy to count as ABC. Draw the same section with shorter bars and the number of moves grows.
Missing waves arise when monowaves combine into a polywave, and the hidden wave is almost always a single monowave. A polywave or anything larger doesn't vanish whole. The cause is the time frame: whatever frame you choose, shorter ones hold more moves, and a pattern completed on a short chart looks simpler on a long chart because there aren't enough points to draw it. In an official 2008 Q&A after the book, Neely called this phenomenon complexity compression. The same answer gives an example where plotting the high and low every 12 hours instead of every 24 reveals a missing wave 4.
We counted BTC's March 2025 advance on each time frame. The section runs from $83,825 at midnight UTC on March 1 to $95,000 at 5 PM on March 2, and on the daily chart it's three monowaves, a, b and c.
| Wave chart | Monowaves | Note |
|---|---|---|
| Daily | 3 | 4 data points (including the start) |
| 12-hour | 7 | |
| 4-hour | 15 | Includes 2 points with undetermined high/low order |
| 1-hour | 64 | High/low order within a bar can't be verified |
c, a single monowave on the daily chart, splits into three on the 4-hour chart. In the middle is a monowave that fell 1.57%, from $88,673 to $87,279. On the 1-hour chart, c shows as five.

Lower time frames show more waves simply because the bars are shorter. Whether such a wave belongs in the count depends on the conditions in the next section.
Where missing waves can occur is fixed
A missing wave can't go into just any pattern. Missing waves occur only at the polywave level, never at multiwave or above, and standard corrections such as a single zigzag, flat or triangle can't contain them.
- Complex-correction polywave: the most likely place, and what goes missing is practically always the X wave. The X wave is the connecting wave linking two corrections (Part 12), and as the smallest correction inside a complex correction it's the first to vanish as the time frame grows.
- Wave-1-extended impulse: wave 4 can go missing. The whole then looks like a zigzag where c is equal to or shorter than a.
- Wave-5-extended impulse: wave 2 is the smallest and most likely to go missing. The whole then looks like a zigzag where c is equal to or longer than a.
The same Q&A adds one more condition: missing waves occur only in patterns that span 3 or 5 time units. Each high/low point on the wave chart is one unit. Following the Q&A's 3-time-unit zigzag example, we count time units as the number of data points excluding the start.
- 3 time units: if it doesn't fit a known pattern, an impulse with a missing wave 2 or 4 is the best explanation.
- 5 time units: if the first correction is near the bottom of the range and the second near the top, but it doesn't fit the rules, a complex correction with a missing middle X wave is the best explanation.
Before using a missing wave, write down which case above applies. If none does, recount.
When data points are at least twice the minimum, don't consider missing waves
The number of data points matters too. Each pattern has a minimum number of data points, including the start, that it needs to complete without a missing wave. The range where missing waves are possible runs from "half the minimum + 1" to "twice the minimum − 1".
| Pattern | Minimum data points | Range where missing waves are possible |
|---|---|---|
| Impulse, triangle | 8 | 5–15 |
| Zigzag, flat | 5 | 3.5–9 |
| Double zigzag, double flat | 10 | 6–19 |
| Triple zigzag, triple flat | 15 | 8.5–29 |
- Below the minimum, above half: if the count is right, there's a missing wave. The count may also be wrong.
- At or above the minimum, below double: the likelihood shrinks but remains.
- Double or more: a missing wave is very unlikely, so don't consider it.
- Half or less: the pattern is too simple and looks like a monowave or a simpler correction.
Data points here are the high/low points plotted on the wave chart, a different number from the monowave count.
- March 2025 advance: 4 daily data points, 3 time units. It's below the zigzag minimum of 5, within the 3.5–9 range, and also meets the time-unit condition.
- August 2026 advance: from $62,275 on August 1 to $81,479 on August 28. 54 daily data points, 6.8 times the impulse minimum, and 43 monowaves.
For the March advance, either the zigzag count is right and a wave is missing, or the count is wrong and has to change. For the August advance, don't explain a failed impulse count with a missing wave; recount the 43 monowaves from scratch.
A wave seen on a lower time frame becomes part of the count only if it passes the rules
Don't add a wave to the count just because it showed on a lower time frame.
Read as a zigzag, as the daily chart suggests, the March advance has c ($9,949) at 3.64 times a ($2,733). When C is at least 161.8% of A in a zigzag, consider an impulse 1-2-3 first. The Q&A example was also a 3-time-unit advance, with C about 400% of A, and it offers two readings: the advance started from the b low, or an impulse started from the low with wave 4 missing.
We tested the impulse alternative by inserting the 1.57% decline from the 4-hour chart as wave 4.
| Wave | End price | Time |
|---|---|---|
| 1 | $86,558 | 4 hours |
| 2 | $85,051 | 34 hours |
| 3 | $88,673 | 1 hour |
| 4 | $87,279 | 1 hour |
| 5 | $95,000 | 1 hour |
- Overlap: the wave-4 low of $87,279 is above the wave-1 high of $86,558, so there's no overlap.
- Extension: wave 5's $7,721 is 2.13 times wave 3, so wave 5 is extended.
- Wave-2 time: 8.5 times wave 1's time. It exceeds the trending-impulse limit seen in Part 6 (100–300% of wave 1's time).
- Retracement ratio: in a wave-5-extended impulse, wave 4's retracement of wave 3 should be larger than wave 2's retracement of wave 1. Here it's the opposite: 38.5% for wave 4 and 55.1% for wave 2.
- Missing location: in a wave-5-extended impulse the wave that goes missing is wave 2, but here the missing candidate is wave 4. Since the Q&A example also allowed a missing wave 4, we don't discard the count on this point alone and judge it by time and retracement ratio instead.
What happened next also argues against this alternative. An extended wave 5 isn't fully retraced unless the whole move is wave c of a larger correction or the last wave of a larger wave-5-extended impulse.
- Wave 5: ended in 1 hour.
- Break of the wave-4 low: 25 hours after the high, a 1-hour close below the wave-4 low fully retraced wave 5.
- Subsequent low: $81,500 at 3 PM on March 4, retracing 120.8% of the $11,175 advance.
So a missing-wave-4 candidate did show on a lower time frame, but the count failed on time and retracement ratio, and the later move contradicted it too.
Confirm a correction that looks like an impulse with three clues
A five-leg advance with the longest wave 3 is easy to count as an impulse. Neely calls it emulation when one pattern looks like another, and it leads you to mistake an impulse for a correction or vice versa. Emulation occurs only in short polywave-level moves, and it usually means a wave is missing. A double failure that looks like a triangle until the wave taken as d passes the a high, and a triple zigzag that looks like an impulse, are also examples of emulation.
A double flat with a missing X wave looks like a wave-3-extended impulse. There are three clues.
- Clue 1: the wave taken as wave 2 ends after retracing wave 1 by 61.8% or more.
- Clue 2: there's no alternation of time, price or structure between waves 2 and 4.
- Clue 3: the wave taken as the extended wave 3 is 161.8% of wave 1 or less.
When these clues appear, split the longest wave (the apparent wave 3) in half and assume a wave is missing in the middle.
On the BTC daily wave chart, we took the advance from April 7 to 11, 2025, made of five monowaves, as an impulse candidate.
| Wave | End | Time |
|---|---|---|
| 1 | April 7, $81,244 (start $74,508) | 7 hours |
| 2 | April 9, $74,620 | 35 hours |
| 3 | April 9, $83,588 | 20 hours |
| 4 | April 10, $78,464 | 19 hours |
| 5 | April 11, $84,300 | 29 hours |
- Clue 1: wave 2 retraced 98.3% of wave 1's $6,736. Applies.
- Clue 2: wave 2 is 35 hours and wave 4 19 hours, so there's time alternation. Doesn't apply.
- Clue 3: wave 3's $8,968 is 1.33 times wave 1. Applies.
- Impulse rules: the longest wave 3 is 1.33 times the next-longest wave 1, short of the extension rule (at least 161.8%). The wave-4 low of $78,464 goes below the wave-1 high of $81,244 and overlaps.
- Data points: inserting a missing wave makes it a double flat, so compare with the double-flat standard. 10 daily data points equal the minimum of 10, so the possibility remains but shrinks.

Redraw the longest wave 3 on 12-hour bars and a missing-X-wave candidate does appear.
- Wave 3 on 12-hour bars: three monowaves. There's a 2.53% decline from $77,979 to $76,010 on April 9.
- Position of the decline: the high of the decline sits at 37.5% of wave 3's price range. It isn't the middle of a split in half.
The time-unit condition isn't met: 10 daily data points make 9 time units, neither 3 nor 5. Even taking the 5 monowaves as 5 time units, the low of the second correction, wave 4, is at 40.4% of the range ($74,508–$84,300), failing the near-the-top condition.
Two clues fit, and the impulse count fails the extension rule as well. But because the time-unit condition isn't met, we don't insert this decline as a missing X wave. Instead, recount from scratch on the 12-hour wave chart, where the decline shows, to test for a double flat, and judge by the move after the pattern ends.
Enter at the price where an alternative is invalidated
Below is an example trade plan, separate from Neely's pattern rules. Using the March example, it shows how the price that invalidates a missing-wave alternative can serve as the entry trigger.
- Entry condition: in an advance of 4 daily data points (3 time units), c is at least 1.618 times a, and a retracing monowave shows inside c on a lower time frame. On March 2, 2025, c/a was 3.64, and a decline from $88,673 to $87,279 showed on the 4-hour chart.
- Entry: sell when a 1-hour bar closes below $87,279, the wave-4 low of the missing-wave-4 alternative. The 1-hour bar at 6 PM UTC on March 3 closed at $87,133.
- Stop-loss: above the $95,000 high, 9.03% above the entry price.
- Invalidation: even before the stop, if a 1-hour bar closes back above $87,279, put the missing-wave-4 alternative back as a candidate and close the position. In this example no such close came before the $81,500 low at 3 PM on March 4. That low was 6.46% below the entry price, and the high over the following 7 days was $94,884, not reaching the stop.
At 9.03% the stop is wide, so keep the same loss limit by cutting the position size.
Check a missing wave twice: on the lower time frame and against the rules
Before putting a missing wave into a count, check two things.
- Whether it shows on a lower time frame: in both the March and April examples, the candidate wave showed on 12-hour or 4-hour bars. If it doesn't show, put a question mark on the count and judge by the move after the pattern ends.
- Whether the count with it passes the rules: re-measure from scratch whether the data-point count is in range, whether there are 3 or 5 time units, whether the pattern type and location are in the list above, and whether it still passes the time, ratio and extension rules after insertion.
A missing wave inside an impulse can't be proven before the pattern ends. And as the March example shows, a wave that appears on a lower time frame is still no use if the count with it fails the rules.