OptiNod Academy
Channels — judge the structure by which wave crosses the line
Neely's 0-2 and 2-4 lines aren't support and resistance. Using three BTC sections, we show how the wave that crosses a line tells you where waves 2 and 4 ended and which wave extended.
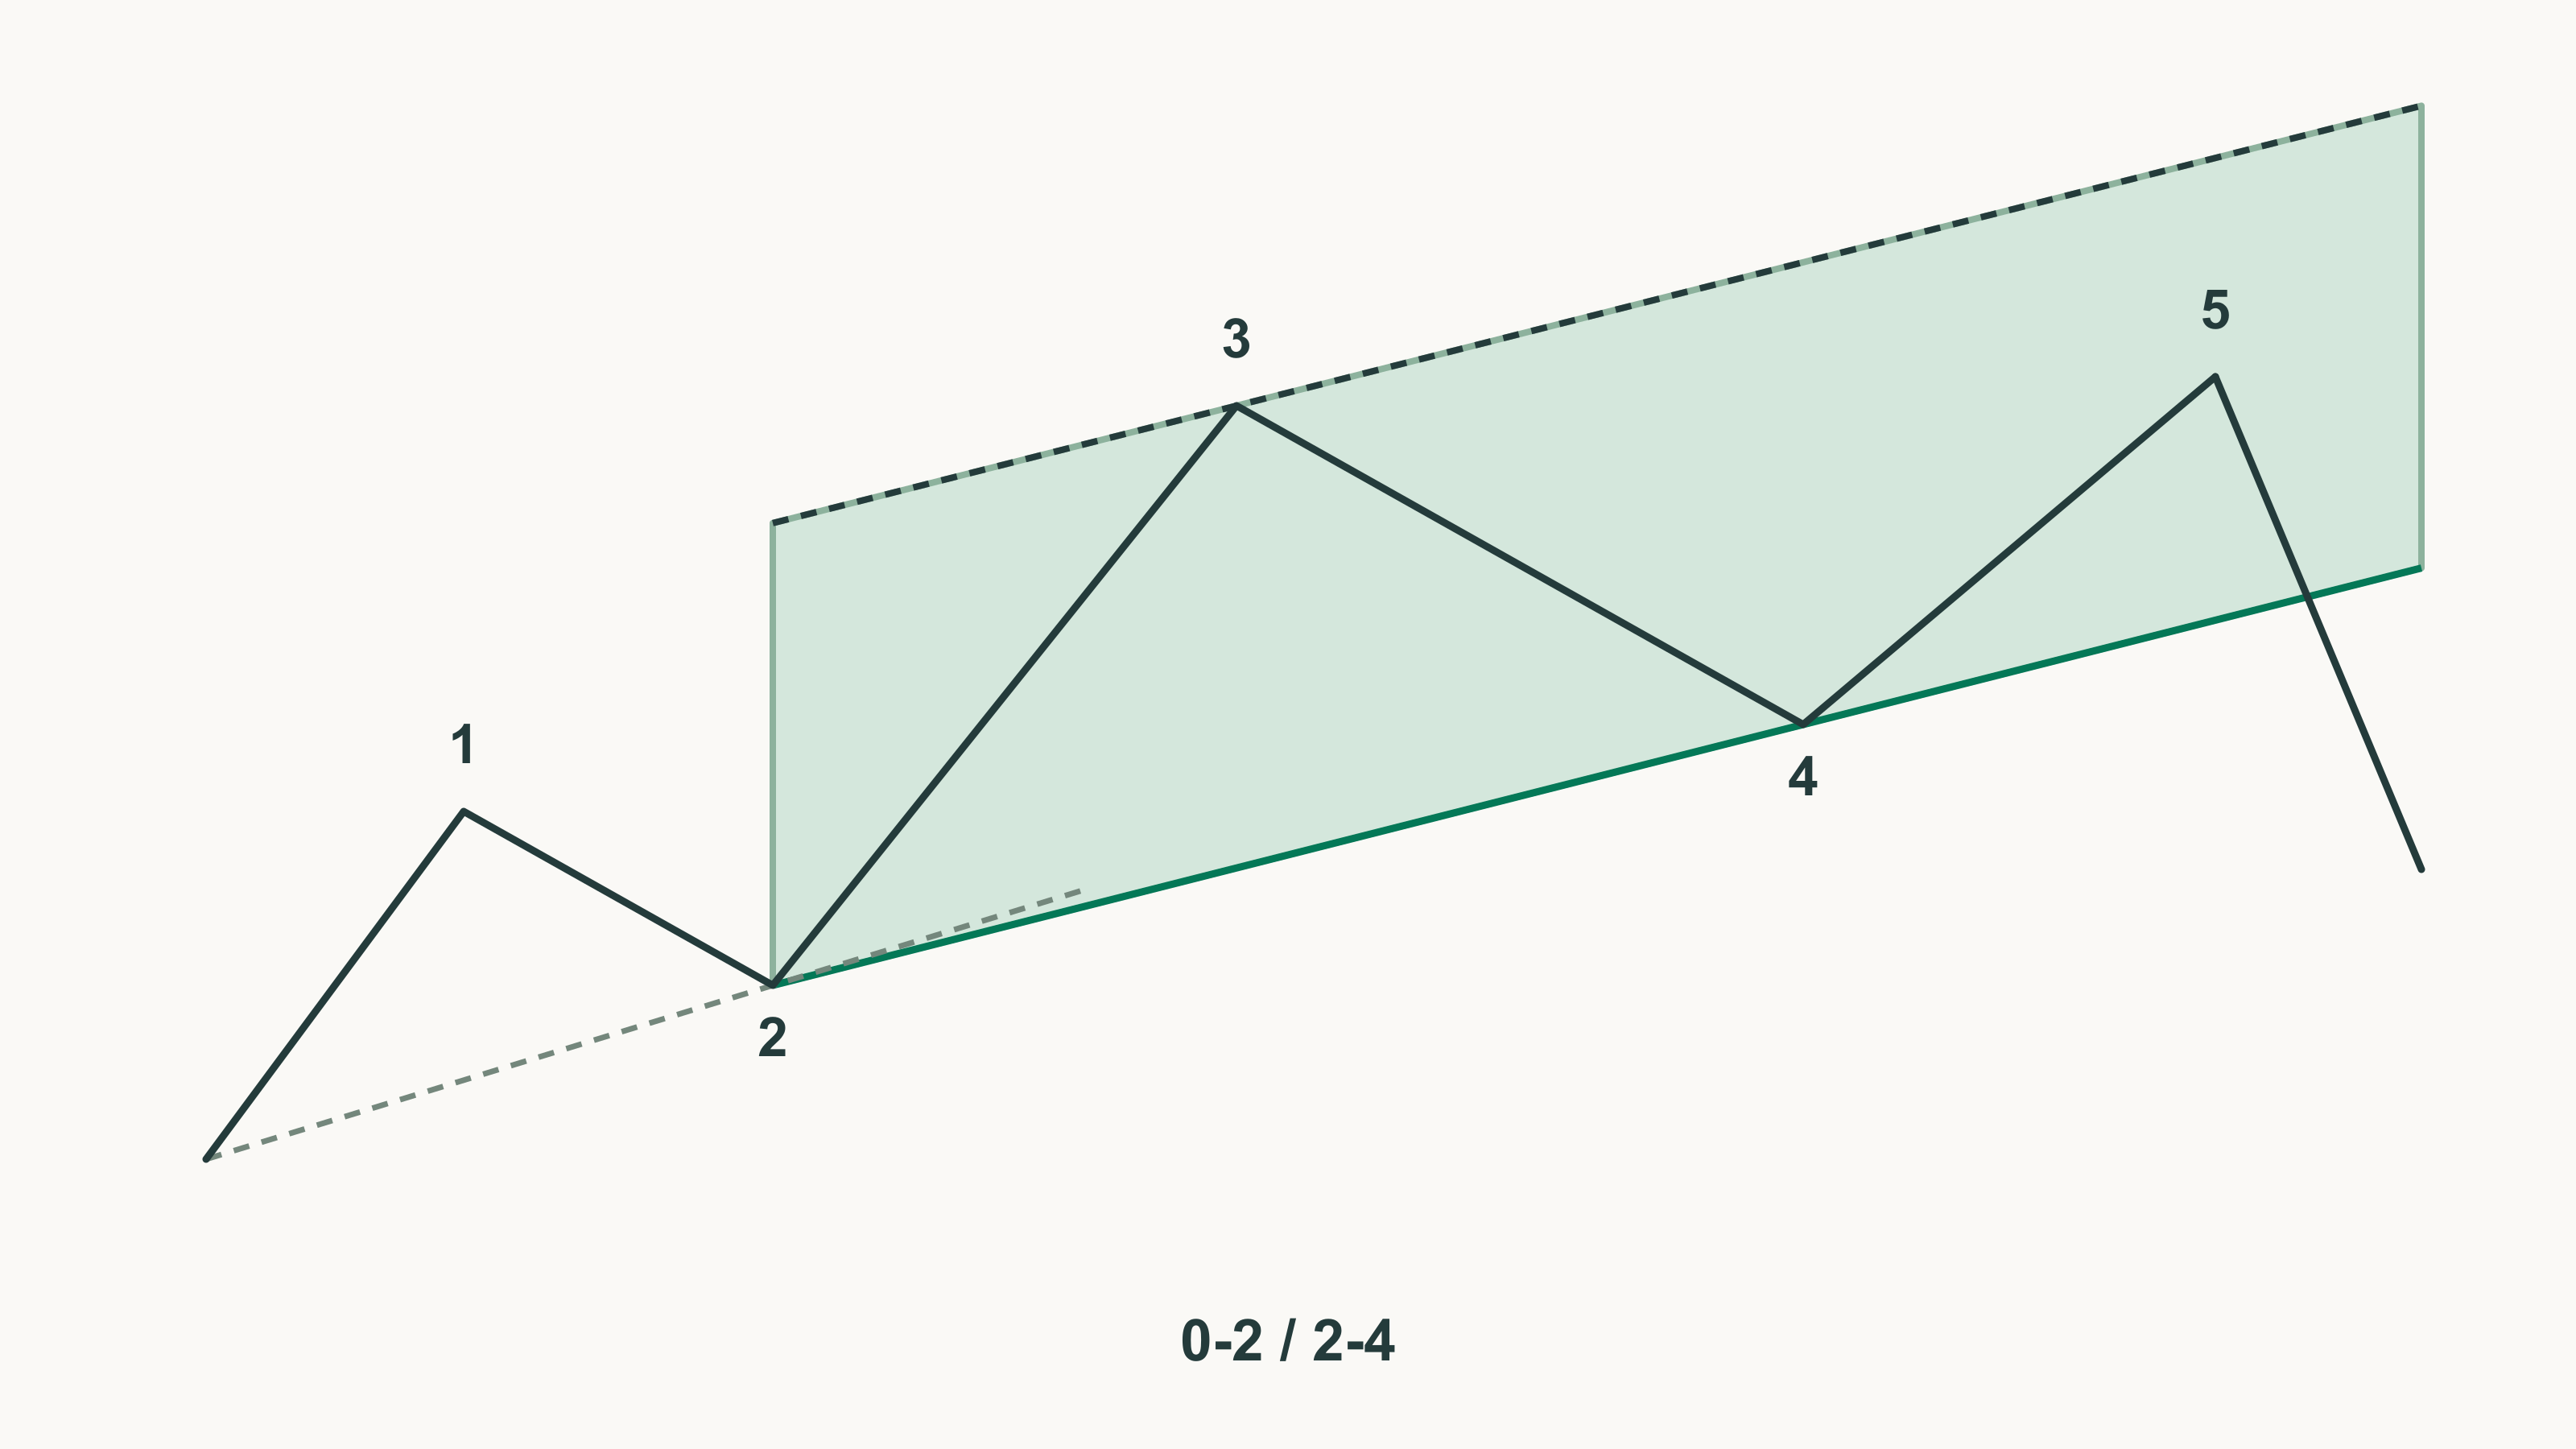
Trendlines are more than support and resistance. Which wave crosses the line tells you where waves 2 and 4 ended and which wave extended.
In Part 12, we checked the X-wave conditions first instead of assuming the whole correction was over just because one ABC had ended. This part turns to channels, which help you judge where waves 2 and 4 ended and which wave is extending while a pattern is still unfolding. Glenn Neely uses channels to judge where waves 2 and 4 ended, whether an impulse has ended, which wave will extend, and whether a terminal or triangle is forming.
Most traders use channels to sell the top line and buy the bottom one, and some read a break of the line as a trend change. Neely sees channels as more effective for confirming turning points than for predicting prices. They're most useful for finding the ends of waves 2, 4, b and d, and nearly useless for waves 1, 3, 5, a, c and e.
So what matters to Neely is which wave crossed the line. If wave 1 or 3 crosses the 0-2 line, the end of wave 2 was set wrong, while wave 4 is allowed to cross the 0-2 line.
Here we draw lines on three BTC sections and measure the touch and break times with 1-hour highs and lows. Neely holds that a log chart is always best for channels and is mandatory once a market has moved 25% or more. So we draw the lines on log prices, also calculate the linear version, and mention it only when the verdict differs. The figures use a linear axis, so the log-based straight lines look slightly curved. We didn't check whether each leg is internally an impulse (:5) or a correction (:3) (Part 4).

If the 0-2 line breaks before the wave-3 condition is met, wave 2 isn't over
A broken 0-2 line is no reason to drop the bullish scenario. The 0-2 line connects the start of wave 1 (0) with the low you've taken as wave 2. If the line is valid, no part of wave 1 or wave 3 crosses it, though part of wave 2 may poke through briefly. If the line breaks before the expected wave 3 has risen 61.8% of wave 1's length, wave 2 is still in progress. Reread the first touch as wave a within wave 2, move the end of wave 2 to the right, and redraw the line through the new low.
Let's measure with the BTC 2023 advance candidate in Figure 1.
- Wave 1: $24,800 on June 15 → $31,804 on July 13, $7,004
- Wave-3 standard: a rise of at least $4,329, 61.8% of wave 1
| Touch | Rise after the touch | Break |
|---|---|---|
| July 18, $29,512 | $905 (12.9% of wave 1) | July 20, 2 PM UTC |
| August 1, $28,586 | $1,462 (20.9%) | August 4 |
| August 17, $25,166 | $2,977 (42.5%) | September 11 |
| September 11, $24,901 | Reached the 61.8% standard at $29,230 on October 16 | None |
All three lines broke before the 61.8% standard was reached, so the end of wave 2 moved later three times. Neither wave 1 nor wave 3 crossed the final line. Wave 2 stretched from 4.9 days, measured to the first touch, to 60.0 days. Neely expects the wave 3 that follows a wave 2 like this to be much longer than wave 1. This candidate's wave 3 was 343.6% of wave 1. Drawing on a linear basis gives the same break times.
When price bounces off a wave-2 candidate low, write down the 0-2 line and the 61.8% standard price before you buy. From the final touch, that's $24,901 plus $4,329, or $29,230.
Set the end of wave 2 at or after the last touch of the line
When the same high prints twice, you have to decide which one ends wave 2. Wave 2 must end after the last touch of the 0-2 line, and at or after the point where it touches the final 2-4 line.
Let's draw the same lines on the 2021 decline candidate that passed all the rules in Part 6. This candidate's wave-2 high of $59,500 appeared twice, at 8 PM UTC on May 8 and at 4 AM on May 10, and as in Part 6, wave 2 ends on May 10. To see why, look at what happens if you end wave 2 at the first high.
| End of wave 2 | 0-2 line | 2-4 line |
|---|---|---|
| First high, May 8 | At 4 AM on May 10, the start of wave 3 crossed the line ($59,218) by 0.48% | Wave 3 crossed by 1.31% |
| Second high, May 10 | Waves 1 and 3 stay 0.03% and 0.08% below the line even at their closest | Wave 3 0.04% below |
Drawn from the first high, wave 3 crosses a line it must not cross. As in the previous section, you move the end of wave 2 later and redraw. At the second high, neither line is crossed. With wave 2 ending on May 10, point spacing on the daily wave chart gives these times:
- Wave 2: 29 steps, 126% of wave 1's 23 steps.
- Wave 4: 53 steps, 279% of wave 3's 19 steps. Counted in daily bars, wave 3 is 9 days against wave 4's 27 days, equal to the upper limit.
Both are within Part 6's time rule (at least 100%, at most 300%), and wave 4 is close to the upper limit.

Unlike waves 1 and 3, wave 4 is free to cross the 0-2 line or not. This candidate's wave 4 stayed 21.6% below the line even at its closest, so it never touched it. Don't discard a count just because wave 4 crossed the 0-2 line. Whether wave 4 entered wave 2's price range is a separate question, answered by Part 6's overlap rule.
If wave 3 crosses the 2-4 line, that line doesn't hold
The 2-4 line connects the end of wave 2 and the end of wave 4. Except when wave 5 is a terminal, no part of waves 3 or 5 crosses this line. This rule comes from NEoWave and isn't part of orthodox Elliott theory. Wave 4 must also end at or after the point where it touches the final 2-4 line. If the assumed 2-4 line breaks before wave 5 passes wave 3's high and the reaction is weak, wave 4 is still in progress, and the first low is wave a of wave 4. If price breaks sharply through the 2-4 line without passing wave 3's high, you have a truncated-wave-5 candidate.
The 2023–2024 advance candidate in Figure 3 fails this rule.
- 2-4 line: connects the end of wave 2 at $24,901 on September 11, 2023 and the end of wave 4 at $38,555 on January 23, 2024.
- First break: in the middle of wave 3, the September 25 low of $26,020 first went below the line ($26,037).
- Deepest point: $26,555 on October 12, 3.6% below the line. Drawn on a linear basis, the deepest point is 5.4% below.
There's no point keeping this line and waiting for a break after wave 5. Reset the end of wave 2 or wave 4, or look at counts other than an impulse first.
Confirm the location of the extension by whether wave 5 crosses the upper line
Wave 5 crossing the top of the channel isn't a sign of overheating. Whether it crosses the upper line tells you which wave extended, because the channel takes a different shape for each extension.
- Wave-1 extension: the two lines converge, similar to a terminal. Wave 5 must not touch the upper line, except when wave 2 is very large.
- Wave-3 extension: whichever points you draw from, the two lines are parallel or nearly parallel.
- Wave-5 extension: it widens into a megaphone shape, and wave 5 must stay below the 1-3 line connecting the ends of wave 1 and wave 3.
- Double extension: the rare case where wave 3 is at least 161.8% of wave 1 and wave 5 at least 161.8% of wave 3; wave 5 usually crosses the 1-3 line.

In the Figure 3 candidate, wave 5 is the longest wave, but the channel doesn't have the wave-5 extension shape.
- Slopes of the two lines: the daily slope is 0.327% for the 2-4 line and 0.237% for the 1-3 line. The lower line rises faster, so the two lines narrow.
- 1-3 line: wave 5 crossed the 1-3 line on February 26, 2024. Crossing the 1-3 line is a feature of the double extension, but wave 5 is 146.3% of wave 3, short of the double-extension condition (161.8%).
The 2021 decline candidate is the opposite case. Wave 5 ended at $28,805, well short of the line drawn from the end of wave 3 parallel to the 2-4 line ($21,382 at that point). The line through the ends of waves 1 and 5 has a daily slope of -0.85%, close to the 2-4 line's -1.00%. That looks much like a wave-3 extension channel.
A terminal treats the 2-4 line differently. While a terminal unfolds, part of it typically breaks the 2-4 line briefly and then returns. A terminal without such a break is rare but possible. If wave 5 briefly crossed the 2-4 line, check the terminal conditions in Part 7 before discarding the trending-impulse count.
Confirm the end of corrections with the B-D line and the 0-B line
A triangle's basic trendline is the B-D line, and it applies to every variation. When this line breaks, treat the triangle as finished. The opposite line is most often the A-C line, then the C-E line, then the A-E line. The end of wave B in zigzags and flats is found with the 0-B line connecting 0 and the end of wave B.
If the 0-B line breaks before wave C has met its minimum price and time, but price can't get past the last touch point and comes back, take it as a clue that a triangle is forming. Two such false breaks all but confirm one. If the line keeps breaking easily and snapping back during a correction, don't trade in the direction of the break; flag the triangle possibility first. The breakout size and time are covered in Part 11.
Measure Fibonacci ratios between waves in the same direction, and compare by adding to end points
Treating Fibonacci retracement lines as support is not what Neely means by Fibonacci relationships. Neely divides Fibonacci relationships into two kinds.
- Internal relationships: compare the price ranges of two waves directly. Common in standard patterns.
- External relationships: multiply one wave's length by a ratio, add it to or subtract it from another wave's end point, and see whether the market stops at that price. They appear in non-standard complex corrections, terminals and truncated patterns.
Waves a and b move in opposite directions and have no consistent relationship; their ratio is used to judge wave a's structure. It's the same reason Part 3 doesn't use retracement ratios as targets.
On the 2021 decline candidate, the internal relationships of a wave-3 extension fit only in part.
- Wave 5 / wave 3: 42.5%, passing the under-61.8% condition.
- Wave 1 / wave 3: 60.8%. In a wave-3 extension, wave 1 must not be 61.8% of wave 3, and this value is close to that. It's the inverse of the relationship in Part 6, where wave 3 was 164.6% of wave 1 and slightly exceeded the extension rule.
- Wave 5 / wave 1: 69.9%. It isn't close to any of the 100%, 61.8% or 38.2% relationships waves 1 and 5 show in a wave-3 extension.
The 2023–2024 candidate is the reverse. In a wave-5 extension, wave 3 should be 100% to 261.8% of wave 1. Here it's 343.6%, so the internal relationship fails, but the external one holds.
- Wave 3's high + 100% of the length from 0 to 3: $48,969 + $24,169 = $73,139
- Actual end of wave 5: $73,777, 0.9% above this price.
Neely also says external relationships fit wave-5 extensions better than internal ones. Even so, this candidate failed the 2-4 line test, and in point spacing on the daily wave chart, wave 4's 25 steps are 10.3% of wave 3's 243 steps, so it also fails the time rule (at least 100%) in Part 6. Don't revive a count that failed other rules because one Fibonacci price fit.
When drawing lines, record the scale and break time together
The same line can give a different verdict depending on the scale and how you count time. In the 2021 decline candidate, wave 5 is 14 steps on the daily wave chart and 163 hours in actual time. Here is the first break of the 2-4 line after wave 5, using the moved end of wave 2. The confirmation procedure, in which the break time must be no more than wave 5's time, was covered in Part 8.
| Line | First break | Point spacing | Actual time | Verdict |
|---|---|---|---|---|
| Log | June 29, 1 PM UTC | 15 steps | 168 hours | Fail |
| Linear | June 28 | 12 steps | 5.8 days | Pass |
The log line overshoots wave 5's time by one step, while the linear line stays inside. Actual time gives the same result. When a verdict flips on one step or a few hours like this, don't log it as a pass. Log it separately as a boundary case.
Below is an example trade plan, written as if the 2023 wave 2 were still in progress. It is separate from Neely's pattern rules.
- Drawing lines: draw 0 ($24,800) and the wave-2 candidate low as two lines, log and linear, and write down the touch times from 1-hour bars.
- Wave-3 standard: don't buy until price has risen at least $4,329 (61.8% of wave 1's $7,004) from the candidate low. If a 1-hour low goes below the line before that, move the end of wave 2 to the new low and redraw the line.
- Entry and stop-loss: treat October 16, when price passed $29,230 after the last touch at $24,901, as wave 3 underway, with the stop-loss below $24,901.
- Invalidation: if a 1-hour low goes below the final 0-2 line during wave 3, discard the wave-3 count and treat wave 2 as continuing.
Don't set trade prices off a single channel line. Draw the 0-2, 2-4 and 1-3 lines, and record which wave crossed which line, by how many percent and how many hours later, on both log and linear scales. If the two scales disagree, treat the section as unconfirmed and wait for the next move.