OptiNod Academy
Complex corrections and X waves — a correction can continue after one ABC ends
The move against an ABC isn't automatically a new trend. Judge it by the 2020 X-wave limits (time, monowave count, 161.8%) and by the structure of the next correction.
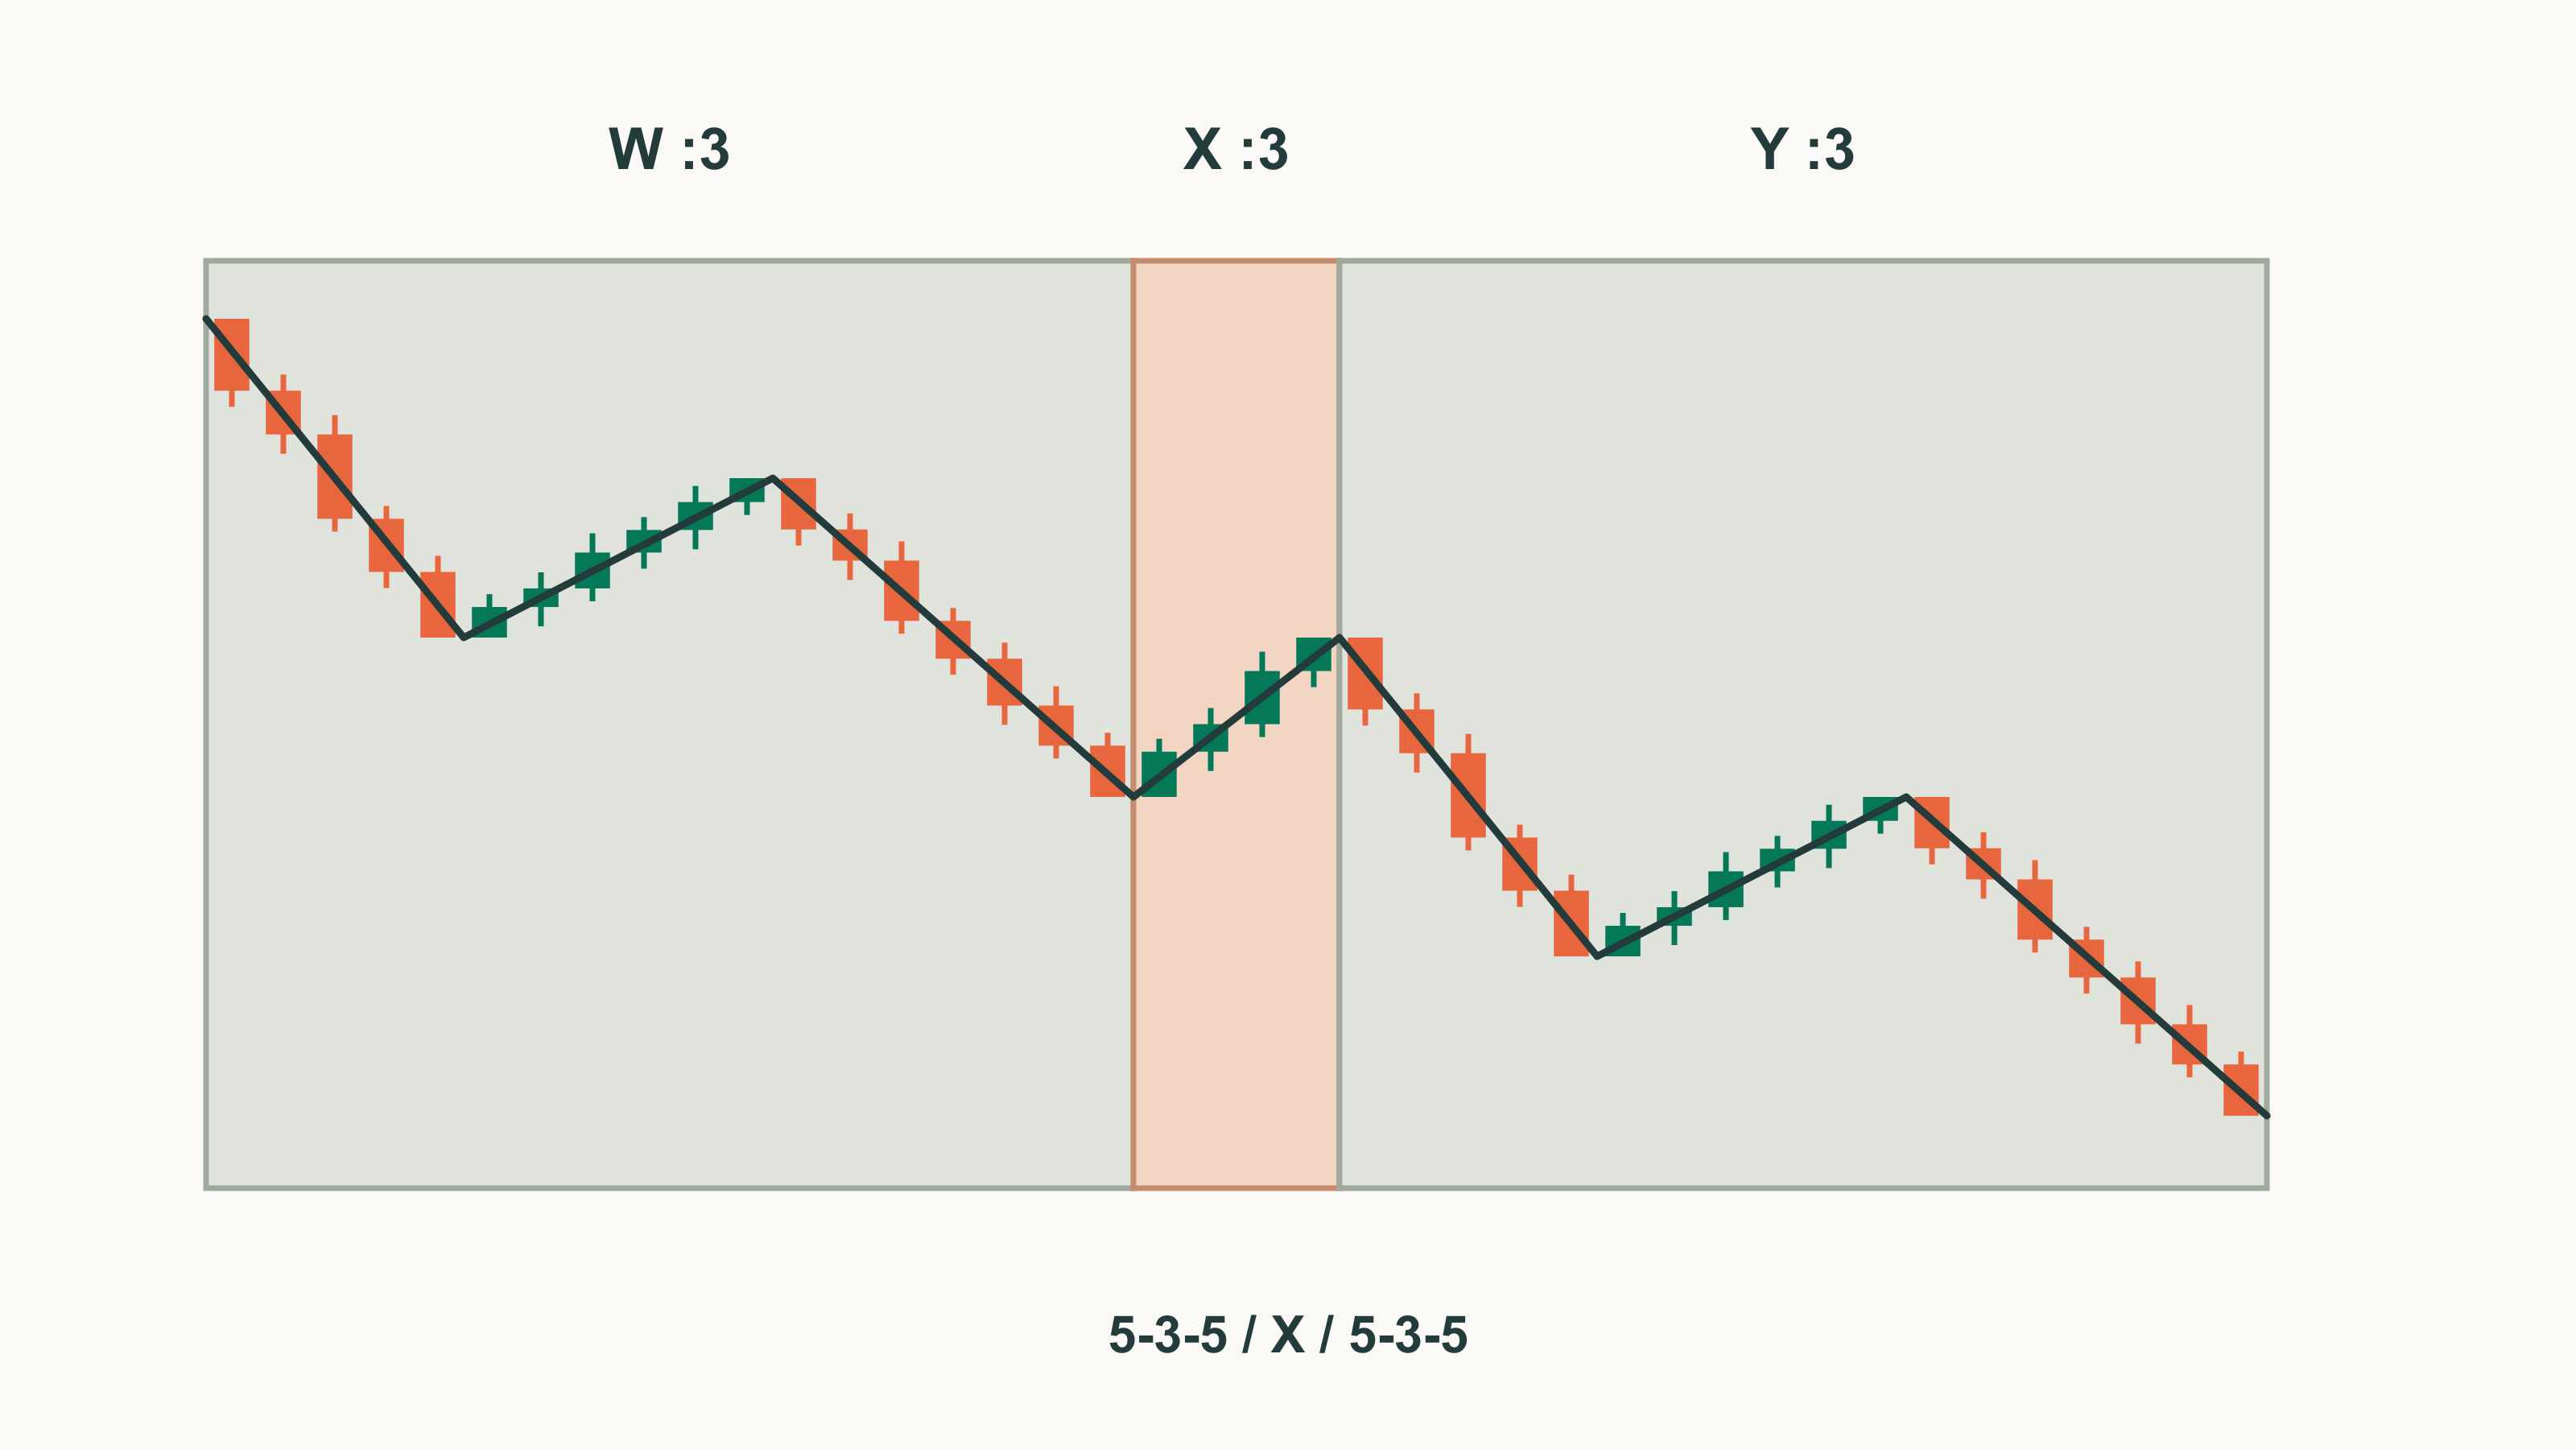
Don't assume the whole correction is over just because one ABC ended; check the X-wave conditions and the structure of the next correction.
In Part 11, we checked where a triangle sits before setting its breakout target. This part covers complex corrections, which take more than one correction to finish. The first correction is W, the connecting wave after it is the X wave, and the next correction is Y. With three corrections, the count becomes W-X-Y-X-Z.
Some traders count the move against an ABC as wave 1 of a new trend straight away. If that bounce is really an X wave, the count has to start over once correction Y begins. Others make the opposite mistake and label any drawn-out sideways move W-X-Y. Without conditions on the X wave, you could slap that label on any chart.
In a 2020 official Q&A, Neely set upper limits on the X wave's time, monowave count and price. Here we measure W and X candidates on BTC and ETH sections and check the three limits and the book's X-wave candidate conditions.

The X wave is one more correction that links two corrections
Sitting between W and Y doesn't make a wave an X. The X wave is a connecting wave that separates two standard corrections, and it is always corrective. The forms that can fill the X position are a zigzag, a flat other than the elongated kind, a contracting non-limiting triangle, a single corrective monowave, and some non-standard patterns in the power ratings table (Part 16).
Two clues help you find an X wave.
- Small X: a correction squeezed between two compacted corrections retraces less than 61.8% of the first correction. In this case, X is usually one level less complex than the corrections on either side.
- Large X: when three corrections follow one another and the second retraces 161.8% or more of the first, the second is very likely an X.
If the next correction retraces at least 61.8% but less than 161.8% of the prior one, you don't have a complex correction; go back and analyze the group as a standard pattern. The book states the small-X boundary in some places as "less than" 61.8% and in others as "61.8% or less". We use "less than 61.8%" throughout, since it's the reading cited more often and the stricter one for a small X. The large-X clue conflicts with the 2020 standard covered below.
W and Y must each meet the flat, zigzag or triangle conditions from Part 9 to Part 11. Uncompacted monowaves alone can't make a complex correction. The structure label :3 means a correction and :5 an impulse (Part 4). Look for X after compacting W to :3 the way Part 5 describes.
The name depends on what kind of corrections W and Y are
Complex corrections with a small X are named by the structure of W and Y.
- Double zigzag: 5-3-5, X, 5-3-5. A triple zigzag adds one more X and 5-3-5.
- Double flat: 3-3-5, X, 3-3-5.
- Combination: a mix of zigzags, flats and triangles. A zigzag then a flat, a zigzag then a triangle, and a flat then a triangle are double combinations; triple combinations are zigzag-zigzag-triangle, zigzag-flat-triangle and flat-flat-triangle.
In this list the triangle always comes last, and it is always a contracting triangle. Combinations with an expanding triangle, or with a triangle as W or Y followed by more corrections, aren't on the list. X also tends to differ in form from the prior correction: after a zigzag, X is often a monowave, flat or triangle; after a flat, often a monowave or zigzag. That's a tendency, not a rule you can judge by.
If X covers a larger price range than the prior correction, you have a large-X complex correction. The forms with a large X are the double three (flat-X-flat), the flat-X-triangle combination, and their triple forms; triple threes are very rare.
Since the 2020 revision, the X wave has three upper limits
In a 2020 official Q&A, Neely pointed out that he wrote the book 30 years ago and said the rules below "override anything written in my book". Where they conflict with the book, follow these rules. Each one compares X with the correction immediately before it.
- Time: the time X took must be no more than the time the prior correction took. This holds whether X's price range is larger or smaller than the prior correction.
- Monowave count: X's monowave count must be no more than the prior correction's monowave count.
- Price: X's price range must be no more than 161.8% of the prior correction's price range.
X only has to stay within each limit; nothing forbids equal values. Break even one, and you drop the X reading and look for another count. The book's large-X clue (161.8% or more) and the 2020 limit meet only at exactly 161.8%. But any X larger in price than the prior correction is a large X, so an X between 100% and 161.8% of the prior correction is still a large-X candidate after 2020.
Here are five candidates measured against both standards. Each value is X relative to the prior correction, with time in point spacing on the daily wave chart.
| Candidate | Price | Time | Monowaves | 2020 limits | Book's X conditions |
|---|---|---|---|---|---|
| BTC 2024, first X | 89.7% | 73 steps / 97 steps | 51 / 69 | Pass | Fail |
| BTC 2024, second X | 89.6% | 47 steps / 57 steps | 35 / 43 | Pass | Fail |
| ETH June 2026 | 35.8% | 18 steps / 100 steps | 15 / 79 | Pass | Small X |
| BTC 2025–2026 | 38.0% | 108 steps / 92 steps | 81 / 69 | Fails time and monowaves | Small X |
| BTC March–May 2026 | 162.3% | 76 steps / 25 steps | 57 / 19 | Fails all three | Large X |
In the 2024 BTC section, the 2020 standard and the book's clues disagree. Take the decline from $73,777 on March 14 to $56,553 on May 1 as W and the bounce to $71,997 on June 7 as the first X. Take the move to July 5 as Y and the bounce to $70,080 on July 29 as the second X. Both Xs pass the three limits, but neither retraced less than 61.8% of the prior correction, and neither was larger than it. So the group goes back to be analyzed as a standard pattern. The 2020 standard sets only upper limits, and staying within them doesn't by itself make a wave an X. The same section was measured as a flat in Part 9, and part of it as an expanding triangle candidate in Part 11.
The ETH candidate in Figure 1 passes both standards. Take the decline from $2,464.91 on April 17, 2026 to $1,505.68 on June 6 as W, and the bounce to $1,849.54 on June 15 as X.

The BTC 2025–2026 candidate fails on time and monowave count. Take October 6, 2025 at $126,200 to November 21 at $80,600 as W, and the bounce to $97,924 on January 14, 2026 as X. Measured in actual time, X is still 118.8% of W.
- An X that ends earlier: ending X at $94,589 on December 9 gives 36 steps and 27 monowaves, which would pass. But price later rose to $97,924, so X can't end there.
The BTC March–May 2026 candidate slightly exceeds the price limit.
- W: $76,000 on March 17 → $65,000 on March 29
- X price limit: $82,798
- X high: $82,850 on May 6, $52 above the limit.
It also lasted longer than W, so the X reading doesn't hold. When a bounce is long and slow, measure the prior correction's time before you call it an X.
Combinations ending in a triangle and running complex corrections don't end at the extreme
Neely holds that most large Elliott patterns don't end at the chart's highest or lowest point. That's because of four forms in which momentum fades: a truncated wave 5, a flat with a failed C, a complex pattern ending in a contracting non-limiting triangle, and the terminal. When a declining combination ends in a triangle, the correction ends at the end of the triangle's wave e, and that point can be higher than the section's lowest point. The new advance is counted from the end of wave e too.
A triple combination that ends in a triangle is easy to mistake for a limiting wave-4 triangle. If you read it as wave 4, you'll wait for one more wave-5 advance, when in fact the whole correction may be ending there. When a long sideways move follows an important low, that sideways move may be a non-limiting triangle that ends the correction.
In Neely's drawing of a running complex correction, a flat follows an advance, X rises above the flat's starting point, and the pattern ends in a triangle. The whole correction finishes above where it began, and a strong impulse follows. Double threes and triple combinations tend to slant in the direction of the trend one degree up; a perfectly horizontal triple combination almost never happens. A running correction is still bound by the 2020 limit of 161.8% on price.
If Y or Z is in progress, hold off on conclusions
A finished-looking Y doesn't confirm W-X-Y. The ETH chart in Figure 1 can be counted with Y ending at $1,512.00 on June 26. Y stopped $6.32 above the end of W, and price then rose to $2,807.34 on September 21. You still have to check separately whether A, B and C inside Y meet the correction rules. And if the next bounce stays within the X limits relative to Y, keep open the possibility that a Z is still to come.
Part 10 counted the same W section as wave C of a larger truncated zigzag candidate. As wave C it would have to be :5; as W, :3. Keep both counts until you've checked the internal structure.
For a section still in progress, work out the limits ahead of time. The numbers below are as of the bar that closed on October 21, 2026. If you take BTC's decline since September 21 as a W that compacts to :3, the limits depend on where you end W.
- With the end of W at $79,800 on October 15: W is 47 steps of point spacing from $87,396 on September 21, and the bounce rose for 13 steps to $84,898 on October 21. If this bounce is an X, it must end within 47 steps, i.e. by the second point of the November 7 bar, not pass $92,090, and have no more than 31 monowaves on the daily wave chart. Measured in actual time, it's 6 AM UTC on November 8, about a day later.
- With the end of W at $80,394 on October 8: X already ended at $84,352 on October 12, and $79,800 on October 15 went below the end of W. The current bounce must be counted as a different wave after that.
In the first case, the bounce is already 67.1% of W, so by the book's conditions it has left the small-X range (under 61.8%). To become a large-X candidate it must get past W's start at $87,396, and the 2020 price limit is $92,090, so X would have to end between $87,396 and $92,090. If it ends lower, reexamine it as a standard pattern. Next to each limit, write down which W it's based on.

Below is an example trade plan, separate from Neely's pattern rules. It sells into the next correction once the X candidate ends, using the ETH numbers from Figure 1.
- Entry condition: the X candidate is under 61.8% of the prior correction (small X) and turns while keeping all the 2020 limits: price at most 161.8%, time at most 100%, and no more monowaves. The ETH X was 35.8%, 18 steps against 100 steps of point spacing, and 15 monowaves against 79.
- Entry: sell when price breaks the start of the last rising monowave within X. That's $1,709.66 on June 15, broken on the 3 PM UTC 1-hour bar on June 18.
- Stop-loss: above the end of X at $1,849.54. That's 8.18% from the entry price.
- Exit: if a rising monowave retraces 100% or more of the preceding falling monowave, exit at the start of that decline. In this case the exit came at $1,719.51 on June 20, a 0.57% loss before costs.
After the exit, Y fell to $1,512.00 on June 26, 11.56% below the entry price. This exit rule closes the position even on small bounces inside Y. A target at the end of W, $1,505.68, would have been missed by $6.32. Decide which one you'll use before you enter.
X-wave verdicts get accurate with the same units and the correction immediately before
- Count on the same chart: count monowaves and time on the same chart. Every value here was counted on the daily wave chart, with the high/low order set by 1-hour bars and without the neutrality rule. In these cases the time and monowave verdicts always agreed, and actual time gave the same results. When time is close to the limit, though, the monowave count can tip the verdict.
- Compare with the correction immediately before: the Q&A only says "the prior ABC", so we compared the second X of a triple three with the Y right before it. That's why, in the 2024 BTC candidate, the second X's time limit was set at Y's 57 steps rather than W's 97 steps. Comparing with W widens the limit, so record which correction you used as the basis.
Meeting the candidate conditions and the three 2020 limits only tells you the move can be read as an X. Neely notes that small-X complex corrections often look like impulses, and only the move after the pattern ends settles which one it was. While Y or Z is in progress, keep at least two counts open until the post-confirmation in Part 8, and drop the X reading the moment it breaks a limit.