OptiNod Academy
The Rule of Similarity and Balance and degree — Timeframes do not decide degree
Two adjacent waves stay same-degree candidates only when one is at least 1/3 of the other in price or time, and a pattern that passes every rule is compacted into a single :5 or :3 that moves up into the larger structure.
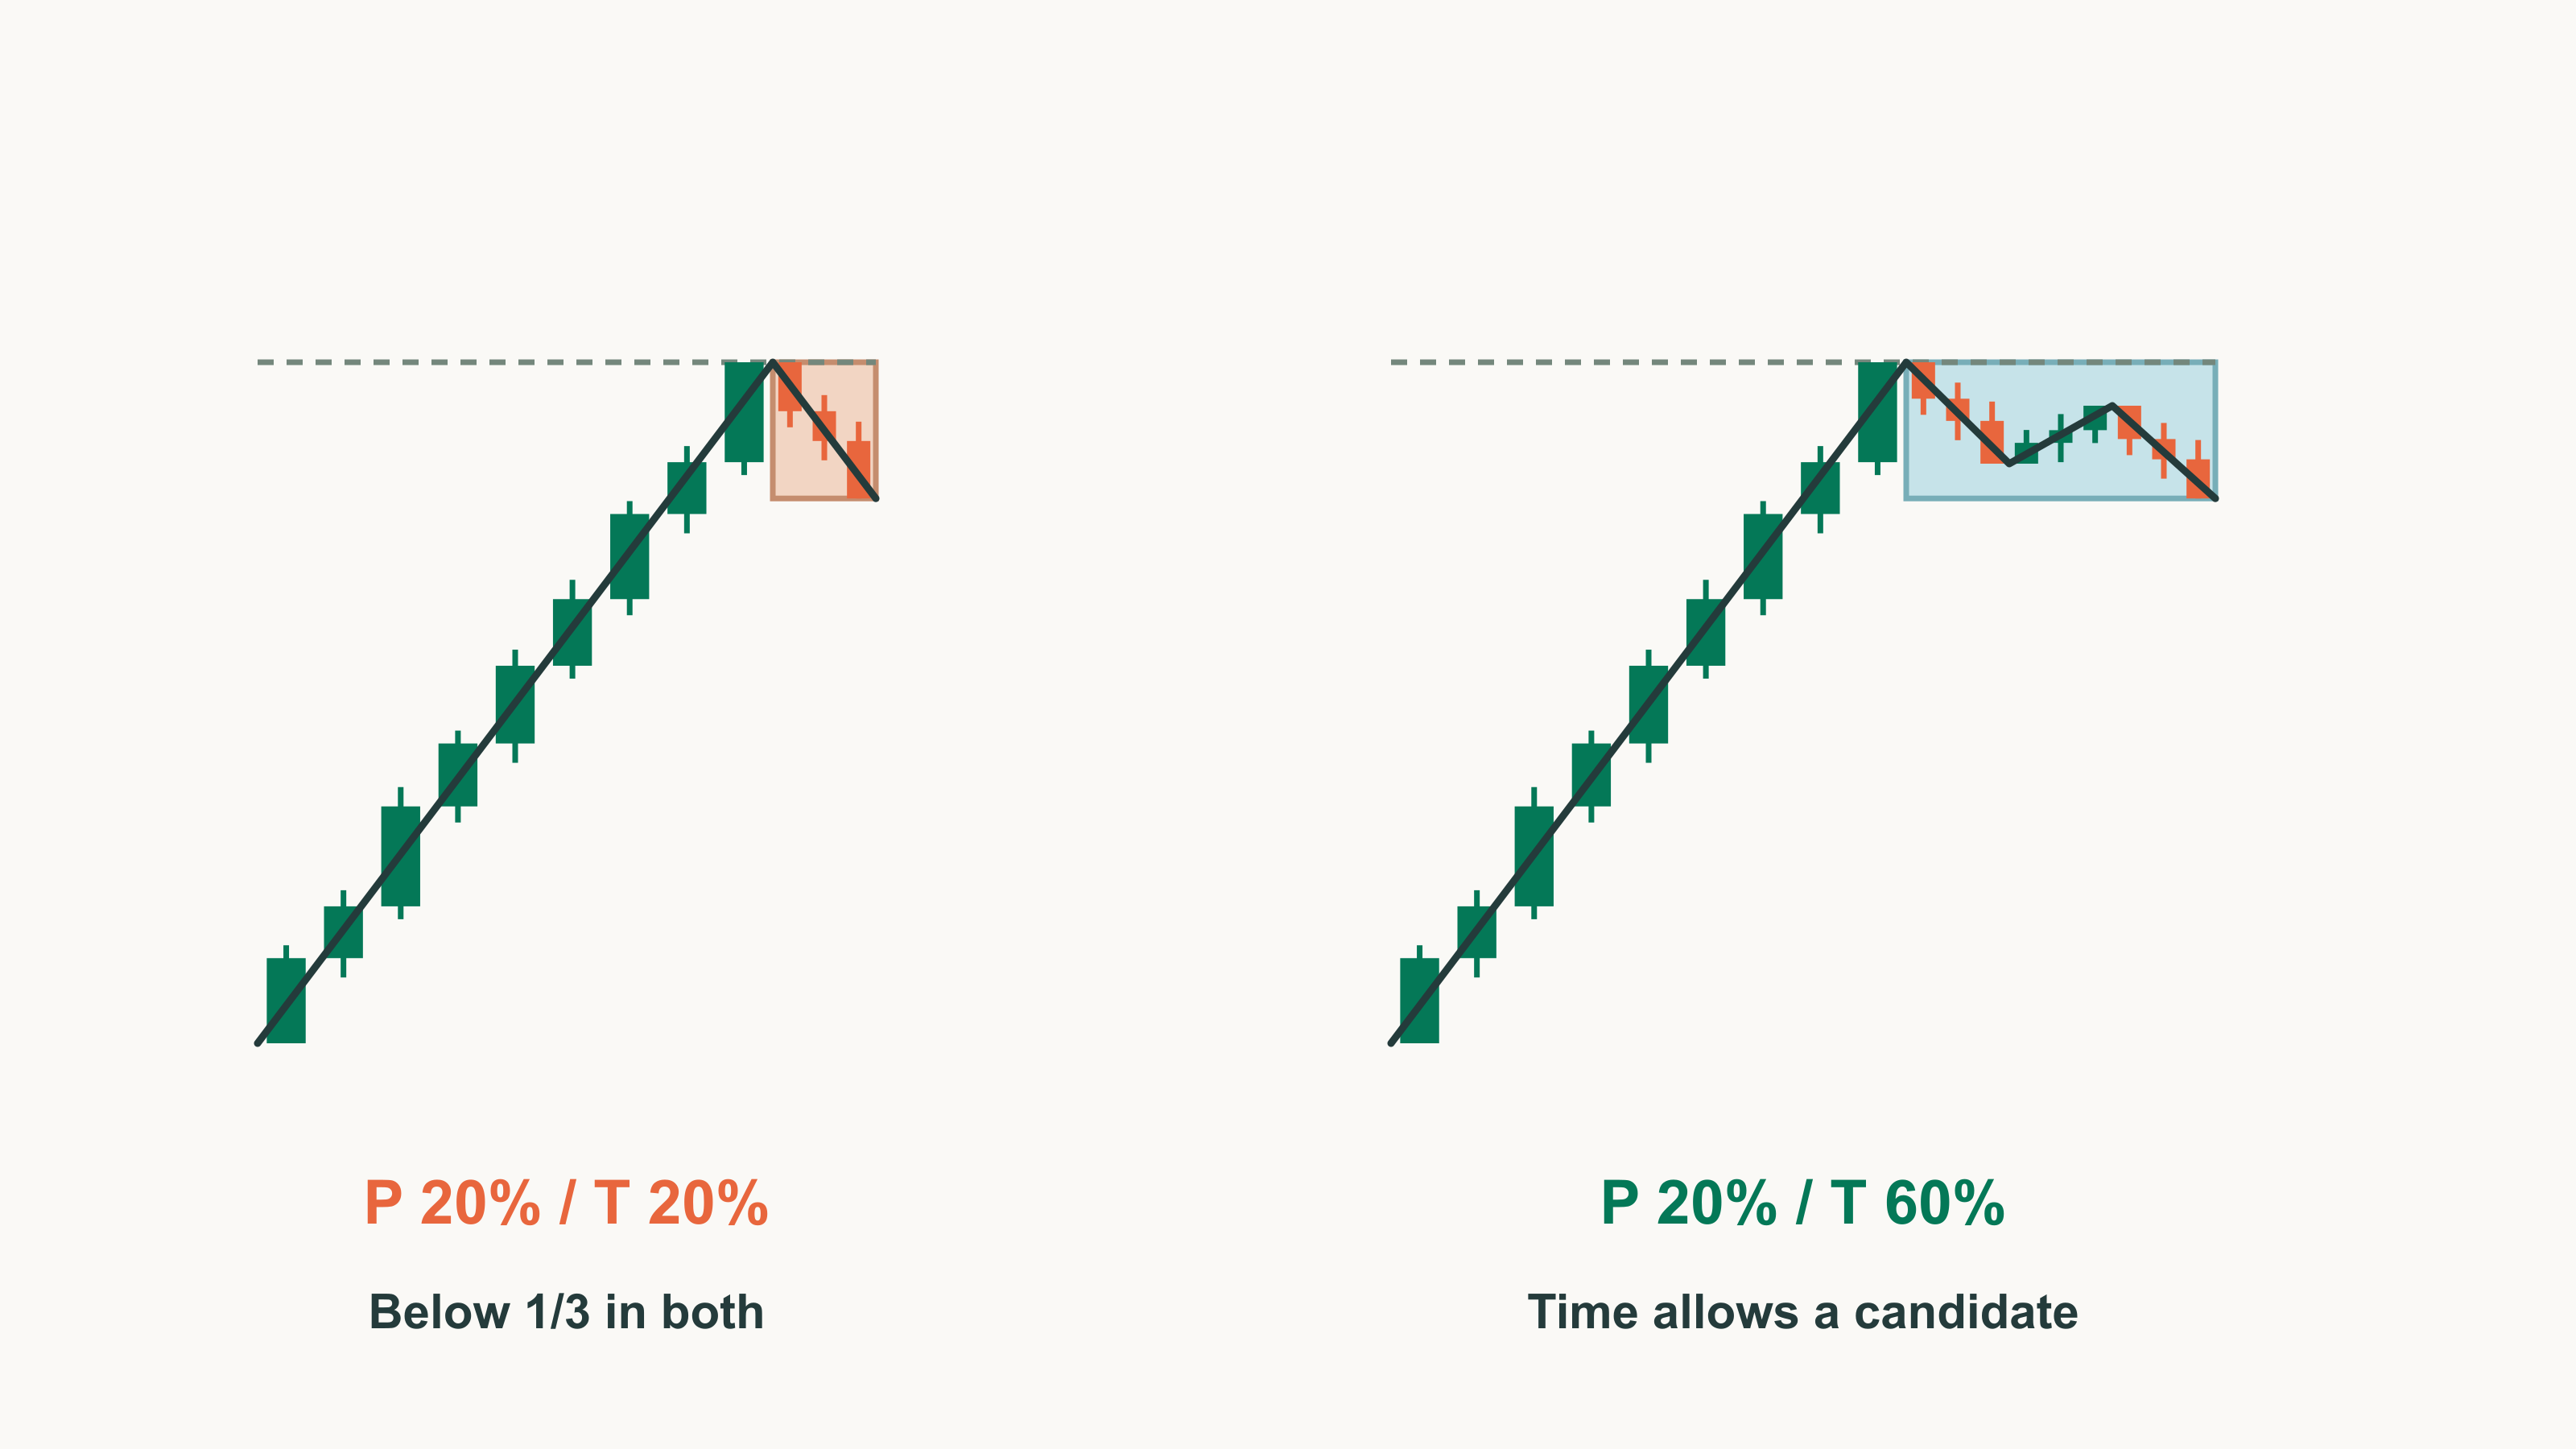
Don't set degree by switching timeframes. Judge whether two adjacent waves share a degree from their price and time relationship.
In Part 4, we found a pattern's start and end from its sequence of :5 and :3 before numbering. The structure label :5 means an impulse and :3 a correction, and five turns alone don't earn a :5. But unless you check that the waves in the sequence are of the same size class, you'll end up counting a small rebound inside a big decline as if it matched the decline itself. Here we cover that check, the Rule of Similarity and Balance, and Compaction, which condenses a completed pattern into one label.
Some traders set degree by timeframe: waves on a weekly chart are large, waves on an hourly chart are small, and any visible rebound becomes a wave-2 or wave-4 candidate. Counting this way mixes moves of completely different sizes into one numbering, even on a single weekly chart.
Glenn Neely holds that degree can't be pinned to a fixed size. Knowing that a wave took one week or moved $100 doesn't tell you its degree. All you can know is that waves of the same degree form within similar ranges of time and price, so the judgment starts by comparing two adjacent waves.

Check same degree with either price or time
It's easy to assume both price and time must be similar for waves to share a degree. The Rule of Similarity and Balance keeps a pair as same-degree candidates if just one of the two fits.
- Price: of two adjacent waves, the smaller one's price range is at least 1/3 of the larger one's.
- Time: of two adjacent waves, the shorter one's duration is at least 1/3 of the longer one's.
Divide by the larger wave, whether it comes first or second. The bar is "at least 1/3", so exactly 1/3 passes. Time is counted in the chart's time unit; in this series, one step between wave-chart points is one time unit. The daily wave chart has two points per bar, so one day is two steps. If both standards fail, the waves are very unlikely to share a degree. Neely reconfirmed in his official Q&A that only one of price and time needs to fit.
Passing this rule doesn't confirm the same degree; it only means the waves could share one. According to Neely, similar time is more common within impulse patterns and similar price within corrective patterns.
The 1/3 test isn't the retracement ratio. In Part 3, m1 was the monowave under analysis and m2 the move right after it, and m2/m1 measured how much of the prior wave was retraced. The Rule of Similarity and Balance divides the smaller wave by the larger, whatever the order.
A rebound below 1/3 on both counts is not a same-degree wave 2
In November 2025 BTC fell 25.02% over 10.5 days, from $107,500 to $80,600. It's tempting to call the rebound in the middle wave 2 and count 1-2-3. On the weekly wave chart, this stretch is three monowaves. All times are UTC.
| Wave | Move | Price range | Daily wave chart | Actual time |
|---|---|---|---|---|
| m1 | Nov 11 $107,500 → Nov 16 $93,005.6 decline | $14,494.4 | 11 steps | 141 hours |
| m2 | rebound to $96,043 on Nov 17 | $3,037.4 | 1 step | 16 hours |
| m3 | decline to $80,600 on Nov 21 | $15,443.0 | 9 steps | 94 hours |
In the weekly wave chart's point spacing, each of the three waves is one step, so the time ratio comes out at 100%. That chart can't tell their durations apart, so we count time on the daily wave chart of the same stretch.
- m2 vs m1: price 21.0% and time 9.1% (1 step vs 11), both short of 33.3%.
- m2 vs m3: price 19.7%, time 11.1% (1 step vs 9).
- To pass against m1: the rebound needed to reach $97,837.0 or last 4 or more steps on the daily wave chart. It ended at $96,043 after one step.
By Neely's standard, m2 is very unlikely to share a degree with m1 and m3, so the three waves don't go straight into one pattern. Instead, group m2 with neighboring waves of similar size and confirm that pattern first. Once the group grows to a size similar to m1, combine it with m1 into a larger pattern. A rebound below 1/3 of its neighbors in both price and time doesn't get a wave-2 or wave-4 label.
Small in price but long in time still stays a same-degree candidate
Judged by price range alone, a small pullback looks like a wave of lower degree. BTC in August 2026 shows a pullback that covered little price but took a long time.
- m1: up 27.13% from $62,535.2 on August 14 to $79,500 on August 21, 14 steps on the daily wave chart (162 hours actual)
- m2: down $2,830.0 to $76,670 on August 24, 5 steps (68 hours actual)
The two standards give these results.
- Price: 16.7%, short of the standard. To pass on price, it needed to come down to $73,845.1.
- Time: 35.7% (5 steps vs 14), a pass. The threshold is 4.67 steps, 1/3 of 14, so it had to last to the fifth-step point at 4 a.m. UTC on August 24, and m2 ended exactly at that point. Ending at 4 steps would have failed, at 28.6%. In actual time it's 42.0%, so the verdict holds.
On price and time, then, m1 and m2 are same-degree candidates. In a 2006 Q&A, Neely said the book had left out a third thing to compare: complexity. Of two wave groups, the one with fewer monowaves must have at least 1/3 as many as the other to qualify as the same degree. On the daily wave chart, m1 has 13 monowaves and m2 has 3, or 23.1%. That answer didn't say how to combine complexity with price and time, so we keep the pair as same-degree candidates on price and time and note that it falls short on complexity.
A completed pattern is compacted into a single :5 or :3
When a shape looks like an impulse, it's tempting to reduce it to :5 right away. Compaction reduces a pattern to one basic structure label only when it's complete and has passed every rule.
- Patterns reduced to :5: trending impulse, terminal impulse
- Patterns reduced to :3: zigzag, flat, triangle, patterns containing an X wave
After that, treat the pattern as a monowave carrying one structure label and carry on with the analysis.

The BTC decline from $67,000 on October 20, 2021 to $59,510.6 on October 24 is one monowave on the weekly wave chart. On the daily wave chart it splits into five monowaves. Here's what happens when we treat them as an impulse candidate and apply the rules in turn.
- The three basic conditions: pass. Wave 2 retraces 34.6% of wave 1, less than 100%. Wave 3 ($4,170.2) is shorter than wave 1 ($5,000.0) and longer than wave 5 ($2,237.0), so it isn't the shortest of waves 1, 3 and 5. Wave 4's high of $61,747.6 stays $252.4 short of wave 1's low of $62,000.
- Rule of Similarity and Balance: all four adjacent pairs have price ratios of 34.6–97.7%, above 1/3.
- Extension rule: the longest, wave 1, is 119.9% of the second-longest, wave 3, short of the book standard (161.8% or more). By the standard comparing with the shortest, wave 5 (the 2006 Q&A in Part 6), it is 223.5%, a pass.
- Wave-2 and wave-4 time: on the daily wave chart wave 2 is 1 step and wave 1 is 2, so wave 2 takes 50% of wave 1's time, and wave 4 likewise takes 50% of wave 3's. That fails the 2021 Q&A's wave-2 and wave-4 time condition (100–300%).
So this decline isn't compacted into :5; it's recounted as a correction. Looking like one line on the weekly chart isn't enough to earn that line a :5.
Keep three things in mind with a compacted pattern.
- Degree: raise the compacted pattern's degree one step above the highest degree used inside it.
- Labels: don't carry progress labels such as 1, 2, 3 to the larger chart; carry only :5 or :3.
- Re-evaluate both sides: after compaction, re-evaluate the two waves on either side.
If the decline above were recounted as a correction and compacted into :3, it would clear 1/3 on all three measures against the preceding weekly advance (from $53,879 to $67,000).
| Comparison item | Decline vs preceding advance |
|---|---|
| Price | 57.1% |
| Time (8 steps vs 16 on the daily wave chart) | 50.0% |
| Daily monowave count (5 vs 9) | 55.6% |
Complexity is counted in levels, separately from monowave counts
The 2006 Q&A compared complexity by monowave count. The book's complexity is something else: a level. A monowave is level 0, and a completed pattern with visible subwaves is level 1 or higher. A pattern's level is the highest level among its impulse segments plus 1. So subdividing only corrective parts such as waves 2 and 4 doesn't raise the overall level; only subdivided impulse parts do. A complex correction simply takes the level of its most complex standard correction.
The polywaves, multiwaves and macrowaves introduced in Part 1 also connect to these levels.
- Polywave: level 1
- Multiwave: level 2. A wave in which one or more impulse segments subdivide into polywaves.
- Macrowave: level 3 or higher. A wave containing at least one multiwave and one polywave.
Patterns treated as the same degree must be at the same level or one level apart. We record the complexity level and the monowave-count comparison separately.
Analysis sets the structure on the larger timeframe first and works down
It's natural to think that counting carefully on small bars and working up will reveal the large structure. Neely's rules are indeed laid out bottom-up, stacking small waves into larger ones. But NEoWave's five-step guide, published in 2025, says to do real analysis the other way round, starting from the largest time unit. Build daily, weekly and monthly wave charts from the order of cash highs and lows, and keep each chart at 13–55 monowaves (ideally 21–34). Then find the largest and steepest move on the largest time unit, set its structure first, and apply that count to the next smaller time unit, working down to the daily.
The number of monowaves on BTC wave charts varies greatly with period and timeframe.
| Period | Weekly | Daily | 4-hour |
|---|---|---|---|
| June 1 – October 21, 2026 | 29 | 212 | 1,295 |
| September 21 – October 21, 2026 | 6 | 43 | 289 |
From June on, the weekly falls within 21–34. Getting the daily into 13–55 means starting after September 21. So we set this period's structure on the weekly and use the daily to check details of the last month.

Below is an example trade plan, separate from Neely's pattern rules, using the numbers from the August 2026 case.
- Chart choice: start on the timeframe with 13–55 monowaves. For this period, the weekly (29).
- Degree check: keep a pullback as a same-degree correction candidate only if it is at least 33.3% of the preceding advance's price range, or at least 33.3% of its step count on the daily wave chart. In this case the time threshold was the fifth-step point filling 1/3 of 14 steps, 4 a.m. UTC on August 24.
- Wait: if the pullback stays above $73,845.1 and ends within 4 steps, don't call it wave 2 or wave 4, and don't treat it as a reason to enter.
- Record complexity: note whether the side with fewer monowaves on the daily wave chart has at least 33.3% as many as the other. Here it's 3 vs 13 (23.1%), which falls short; when it does, halve the entry size.
- Entry: after the low of the same-degree candidate pullback ($76,670) is confirmed, enter when price exceeds the prior high of $79,500.
- Stop: below the pullback low of $76,670.
- Invalidation: if price falls below the advance's start at $62,535.2, drop the view of this advance as a single rising wave.
Same-degree judgments get precise with wave charts and records
- Compare on the wave chart: if you don't confirm the order of highs and lows on lower bars, m2's start and end shift, and the time comparison shifts with them. Also record which chart's steps you counted time in: the November 2025 case was 100% in weekly steps and 9.1% in daily steps.
- Passing only makes a candidate: the 1/3 rule just keeps a pair in the running. The complexity levels, the re-evaluation of both sides after compaction and the pattern rules must also fit before a wave can go into a larger pattern.
The monowaves here are split at every change of direction, without the grouping from the Rule of Neutrality or the Rule of Observation. A single-monowave daily rebound like m2 in November 2025 can come out differently once that grouping is applied, so note this beside the judgment. Putting a wave that fails both standards at the same degree breaks the whole count. Keep it at a lower degree, group it with its neighbors, and bring it into the larger pattern once it's similar in size.