OptiNod Academy
Zigzags — sort the variation by wave C's length and anticipate the next move
Neely splits zigzags into normal, truncated and elongated by wave B's depth and wave C's length. We check, on real BTC and ETH data, the move that must follow a short C.
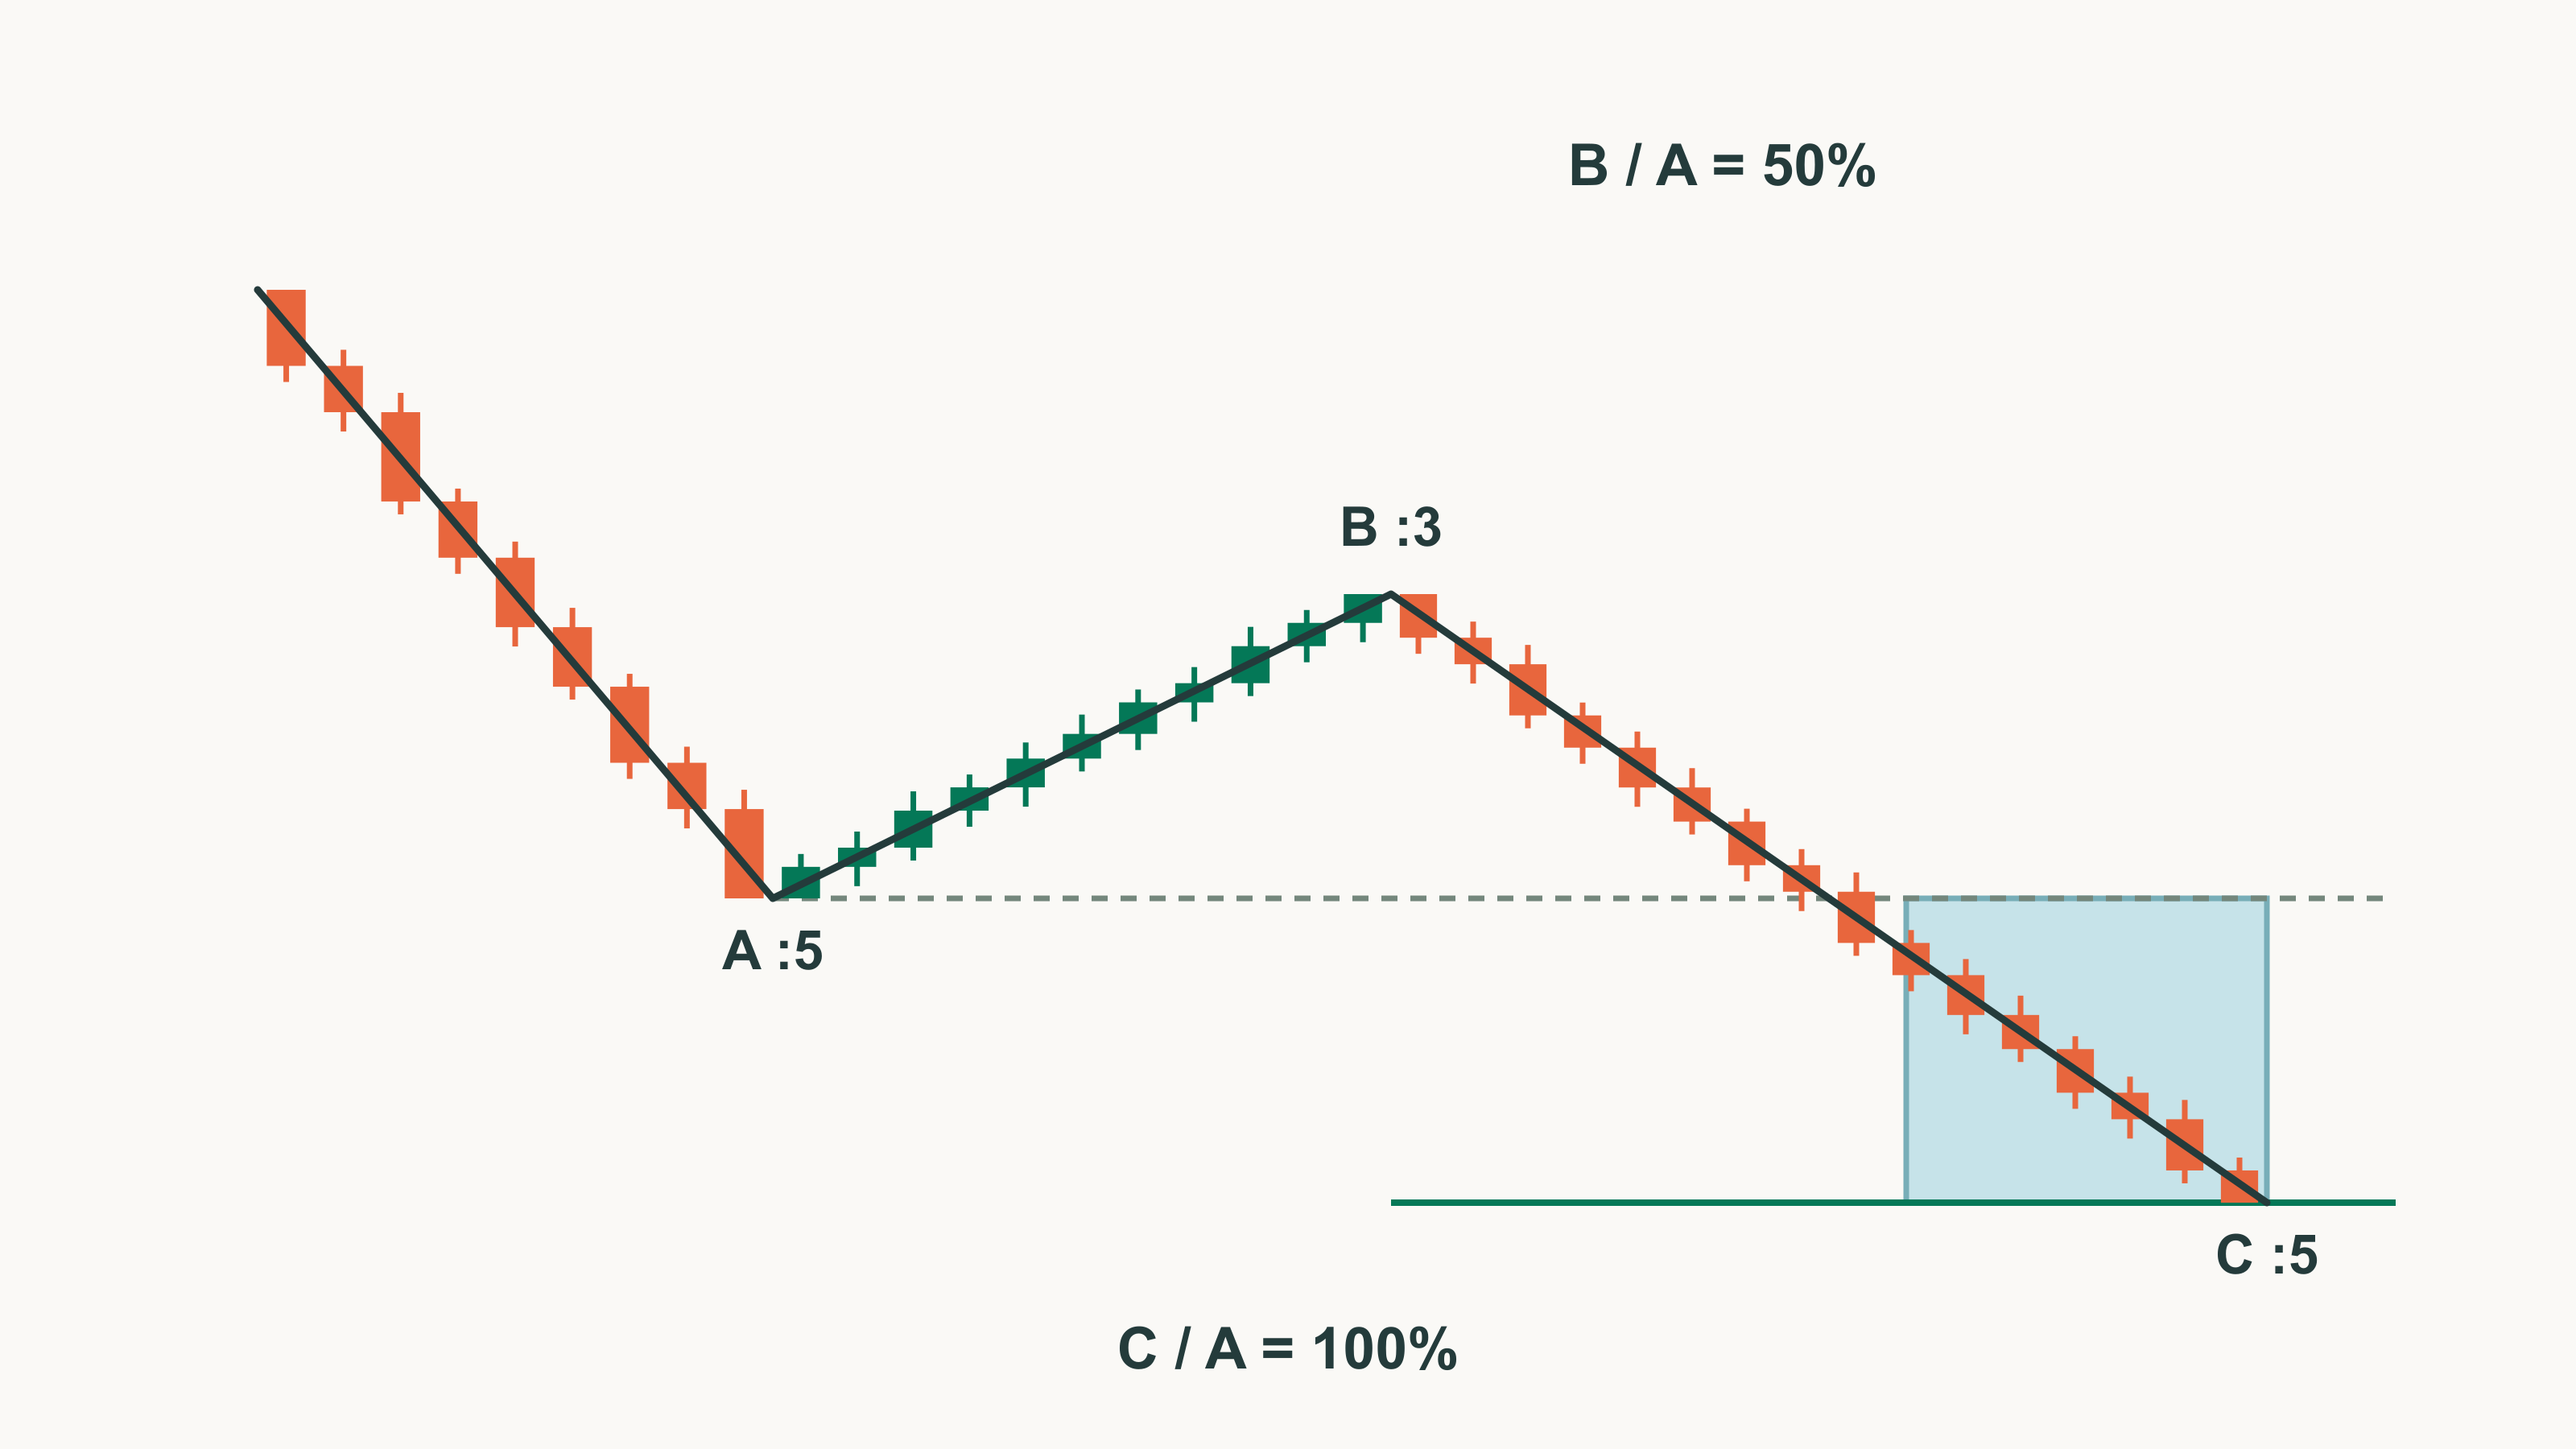
Sort zigzag variations by wave C's length and wave B's depth, and expect a different next move when C ends short.
In Part 9, we saw that a wave B retracing 61.8% or more of wave A makes a flat candidate. The zigzag is the correction on the other side of that line: wave B ends within 61.8% of wave A, and the structure is 5-3-5. Waves A and C are impulsive (:5) and wave B is corrective (:3), using the structure labels from Part 4.
Some zigzag explanations say the correction ends only when wave C equals wave A or travels at least 80% of it. That 80% appears neither in Glenn Neely's book nor in any official Q&A we checked. Make it your end-of-correction condition, and you'll keep treating a zigzag whose C ended short as still in progress.
Neely divides zigzags into three kinds by comparing wave C's length with wave A, and each kind requires a different move from the market once the pattern ends. A rising zigzag candidate in BTC in August 2024 had C/A of 64.9%. That's short of 80%, but by Neely's standard it falls in the normal zigzag range.

A zigzag is a 5-3-5 whose wave B ends within 61.8% of wave A
Three legs that look like ABC aren't automatically a zigzag. A zigzag has three minimum conditions.
- Wave A's position: if a larger-degree impulse comes before wave A, wave A must not retrace 61.8% or more of that impulse.
- Wave B minimum: wave B must retrace at least 1% of wave A.
- Wave C progress: wave C must go past the end of wave A, even by a tiny amount.
Then there's wave B's upper limit: wave B must end at a retracement of no more than 61.8% of wave A's price range. A point inside wave B may briefly poke past 61.8% as long as the end comes back inside. If the end itself is beyond 61.8%, it can't be a zigzag; review it as a flat instead. The time condition came after the book. In a 2008 Q&A, Neely said that wave B in flats and zigzags can't finish in less time than wave A.
The BTC candidate in the figure passes both the price conditions and the 2008 time condition. Time is counted in wave-chart steps. A daily wave chart has two points per bar, so one day is two steps.
| Leg | Move | Price range | vs. wave A | Point spacing | Actual time (1-hour bars) |
|---|---|---|---|---|---|
| A | August 5 $49,000 → August 8 $62,745 | $13,745 | base | 6 steps | 3.7 days |
| B | Down to $56,079 on August 15 | $6,667 | 48.5% | 14 steps | 6.9 days |
| C | Up to $65,000 on August 25 | $8,921 | 64.9% | 20 steps | 10.1 days |
Wave B took longer than wave A, and wave C passed the end of A by $2,255. Our measuring tool doesn't check whether waves A and C are actually :5, though, so this measurement only gets us as far as a zigzag candidate.
Wave C's length falls into three ranges
A zigzag's variation is set by how long wave C is compared with wave A.
- Truncated: wave C is at least 38.2% and less than 61.8% of wave A.
- Normal: wave C's own length is at least 61.8% of wave A and within the 161.8% upper limit.
- Elongated: wave C passes the 161.8% upper limit.
The 61.8% lower limit is measured on wave C's own length. The book gives two reference points for the 161.8% upper limit: the sentence on the normal conditions measures from the end of wave A, while the elongated section and chapter 11 compare wave C's own length with 161.8% of wave A. We judge by wave C's own length ÷ wave A, the stricter method shared by the elongated section, chapter 11 and the 2021 Q&A, and record the value measured from the end of wave A for reference only.
A 2021 Q&A, published after the book, added a general limit. Wave C in flats and zigzags does not exceed about 161.8% of the larger of waves A and B in price, or A+B in time, with exceptions only for triangles and terminals. In a zigzag B is smaller than A, so this limit means wave C's own length is within about 161.8% of wave A.
The August BTC candidate passes both the normal lower limit and the 2021 limits.
- Lower limit: C/A 64.9% clears the normal lower limit of 61.8%.
- 2021 price limit: C divided by the larger of A and B is also 64.9%.
- 2021 time limit: wave C's 20 steps equal A+B's 20 steps, so it's within the limit, right on the boundary; in actual time it's 0.96 times A+B.
Nothing in Neely's rules says this correction is still in progress just because C is short of 80% of A.
A truncated zigzag is confirmed only by an 81% retracement of the whole
One reading says a short wave C means the correction isn't finished. Neely reads a short C as a sign of strong opposing force and calls it truncated only when that force shows up in actual price. A C/A of 38.2–61.8% alone doesn't make it truncated. After the pattern ends, the market must retrace at least 81% of the zigzag's entire price range, and a retracement of 100% or more is more common. A truncated zigzag is very likely a wave of a triangle or part of one.
Treat two BTC declines as truncated candidates, and both ratios fall in the truncated range.
| Candidate | Wave A | End of B | End of C | B/A | C/A | Point spacing (A·B) |
|---|---|---|---|---|---|---|
| December 2024 | December 17 $108,353 → December 20 $92,233 | December 26 $99,964 | December 30 $91,530 | 48.0% | 52.3% | 7 steps · 11 steps |
| May–July 2026 | $82,850 → $59,131 | $67,292 | July 1 $57,800 | 34.4% | 40.0% | 60 steps · 20 steps |
The December 2024 candidate failed the 81% condition. The 81% retracement line was $105,157. The bounce stopped at $102,724 on January 7, 2025, 66.5% of the whole. On January 9, price broke below the end of C at $91,204. Discard the count that saw this section as a truncated zigzag.
The book sets no deadline for the 81% retracement, so we record whether price reached 81% before breaking the end of C. Once that point is broken, a count that ended C there no longer holds. Part 4 used this same section to illustrate a zigzag's label sequence. Even when the labels fit, a truncated zigzag still needs the 81% retracement afterward, and this section fails it.
The May–July 2026 candidate's aftermath matched the description of a truncated zigzag.
- Breaking the 81% line: it rose to $79,500 on August 21, passing the 81% line at $78,091.
- Maximum retracement: $87,396 on September 21, 118.1% of the whole.
But wave B's 20 steps are shorter than wave A's 60, so it fails the 2008 time condition. The retracement is exactly what a truncated zigzag forecasts, yet the A-B-C placement itself needs another look.

When C passes 161.8%, suspect an impulse first
Some traders read an extended wave C simply as a strong C. The elongated zigzag is the variation most like an impulse and usually can't be confirmed until it completes. It also appears in only a few places. It almost always appears as one wave inside a triangle or terminal impulse; in a contracting triangle it can be any leg except wave e, and in an expanding triangle any leg except wave a.
When wave C passes 161.8% of wave A, these three waves are very likely waves 1-2-3 of an impulse, so look at that possibility first. The retracement tells them apart. If it's elongated, the market must retrace at least 61.8% of wave C before passing the end of C; otherwise it's likely to continue as an impulse.
This variation sits awkwardly with the 2021 general limit, which exempts only triangles and terminals and doesn't mention the elongated zigzag. Where elongated zigzags appear does overlap those exceptions, but we found no official source saying whether the elongated zigzag survives the revision.
The March–May 2022 BTC decline shows this conflict.
- Wave A: March 28 $48,190 → April 18 $38,537
- Wave B: up to $42,976 on April 21
- Wave C: down to $26,700 on May 12
Measured three ways, the same wave C gives different results.
| Method | Value | Verdict |
|---|---|---|
| Wave C's own length ÷ wave A (elongated section, chapter 11) | 168.6% | Passes 161.8% |
| End of wave A to end of wave C ÷ wave A (normal conditions) | 122.6% | Reference only (not used for the verdict) |
| Wave C ÷ larger of A and B (2021 Q&A) | 168.6% | Slightly over the ~161.8% limit |
On our criterion, wave C's own length, it exceeds 161.8%, so what follows decides between elongated and impulse. The bounce stopped at $32,399 on May 31, a 35.0% retracement of wave C. On June 12, price broke the end of C at $26,560. It didn't reach $36,759, the 61.8% retracement line required for an elongated zigzag, so by the book's standard you review waves 1-2-3 of an impulse first. Wave B's 6 steps are also shorter than wave A's 41, so it fails the 2008 condition.

Double and triple zigzags join zigzags with X waves
The end of one zigzag isn't necessarily the end of the correction. If another zigzag follows with an X wave in between, it's a double zigzag; two more make a triple zigzag. Among corrective waves, only the zigzag and these combinations can briefly look like an impulse. When the first correction is a zigzag, the X wave is usually a monowave, flat or triangle. A double zigzag isn't fully retraced by the next wave unless it's the last part of a wave-5-extended terminal.
The 2020 revision capped X waves on time, monowave count and price; where it conflicts with the book, follow the revision. Part 12 covers the details. If a zigzag is followed by a move retracing less than 61.8% of it and then another 5-3-5 in the same direction, we also keep a double-zigzag candidate open.
A truncated candidate's 81% line is a weak basis for entry
The 81% retracement confirms a truncated zigzag. Using an ETH candidate, let's see what the numbers look like if you treat that line as a target before the candidate is confirmed.
Below is an example trade plan, separate from Neely's pattern rules.
- Entry conditions: a falling zigzag candidate with B/A of 61.8% or less, C/A of 38.2–61.8%, and B's time at least A's. ETH December 10, 2025 $3,447.44 → February 6, 2026 $1,747.80 → April 17 $2,464.91 → June 6 $1,505.68 gives B/A 42.2%, C/A 56.4%, and B's time of 141 steps, longer than A's 115.
- Entry: buy when price passes C's start of $2,464.91 again. It passed at 10 PM UTC on August 21, 76.7 days after the end of C.
- Stop: below the end of C at $1,505.68, 38.9% from the entry.
- Target: the 81% retracement line of the whole, $3,078.51, 24.9% from the entry, for a reward/risk of 0.64.
- Invalidation: if price breaks the end of C before reaching the 81% line, discard the truncated count.
With reward/risk under 1, skip this entry. The candidate rose to $2,807.34 on September 21, retracing 67.0% of the whole. The October 21 close was $2,473.76, at the 49.9% level, so 81% isn't confirmed yet.
This candidate's wave-A section (December 10, 2025 to February 6, 2026) is the same section measured as a flat candidate (:3) in Part 9. If wave A isn't confirmed as :5, this candidate can't be a zigzag. For a truncated candidate, the 81% line confirms after the fact; consider entering only on a smaller-degree reversal with a nearby stop.
Zigzag verdicts get accurate through structure checks and measurement records
- Structure: our measurements used only the price and time of monowave extremes and didn't check whether A and C are :5 and B is :3. Part 4 explains how to attach structure labels. If the monowaves inside wave A fail the impulse rules, drop that section from the zigzag candidates.
- Measurement method and reference year: when recording C/A, note which method and which year's standard you used. As the 2022 BTC candidate shows, a section can get different verdicts: 168.6% on C's own length, 122.6% from the end of A. The 2008 time condition and the 2021 price and time limits are standards that came after the book.
Also record, separately, when the pattern looks finished and when the 81% or 61.8% retracement is confirmed. Then you can apply the post-confirmation rules from Part 8 on the same record and avoid declaring a short C truncated too early.