OptiNod Academy
Post-pattern confirmation — The time it looked finished differs from the time it was confirmed
Neely's post-pattern confirmation uses price and time conditions that differ by pattern. Record the end-candidate time and the confirmation time separately, and recalculate the entry at the confirmation time.
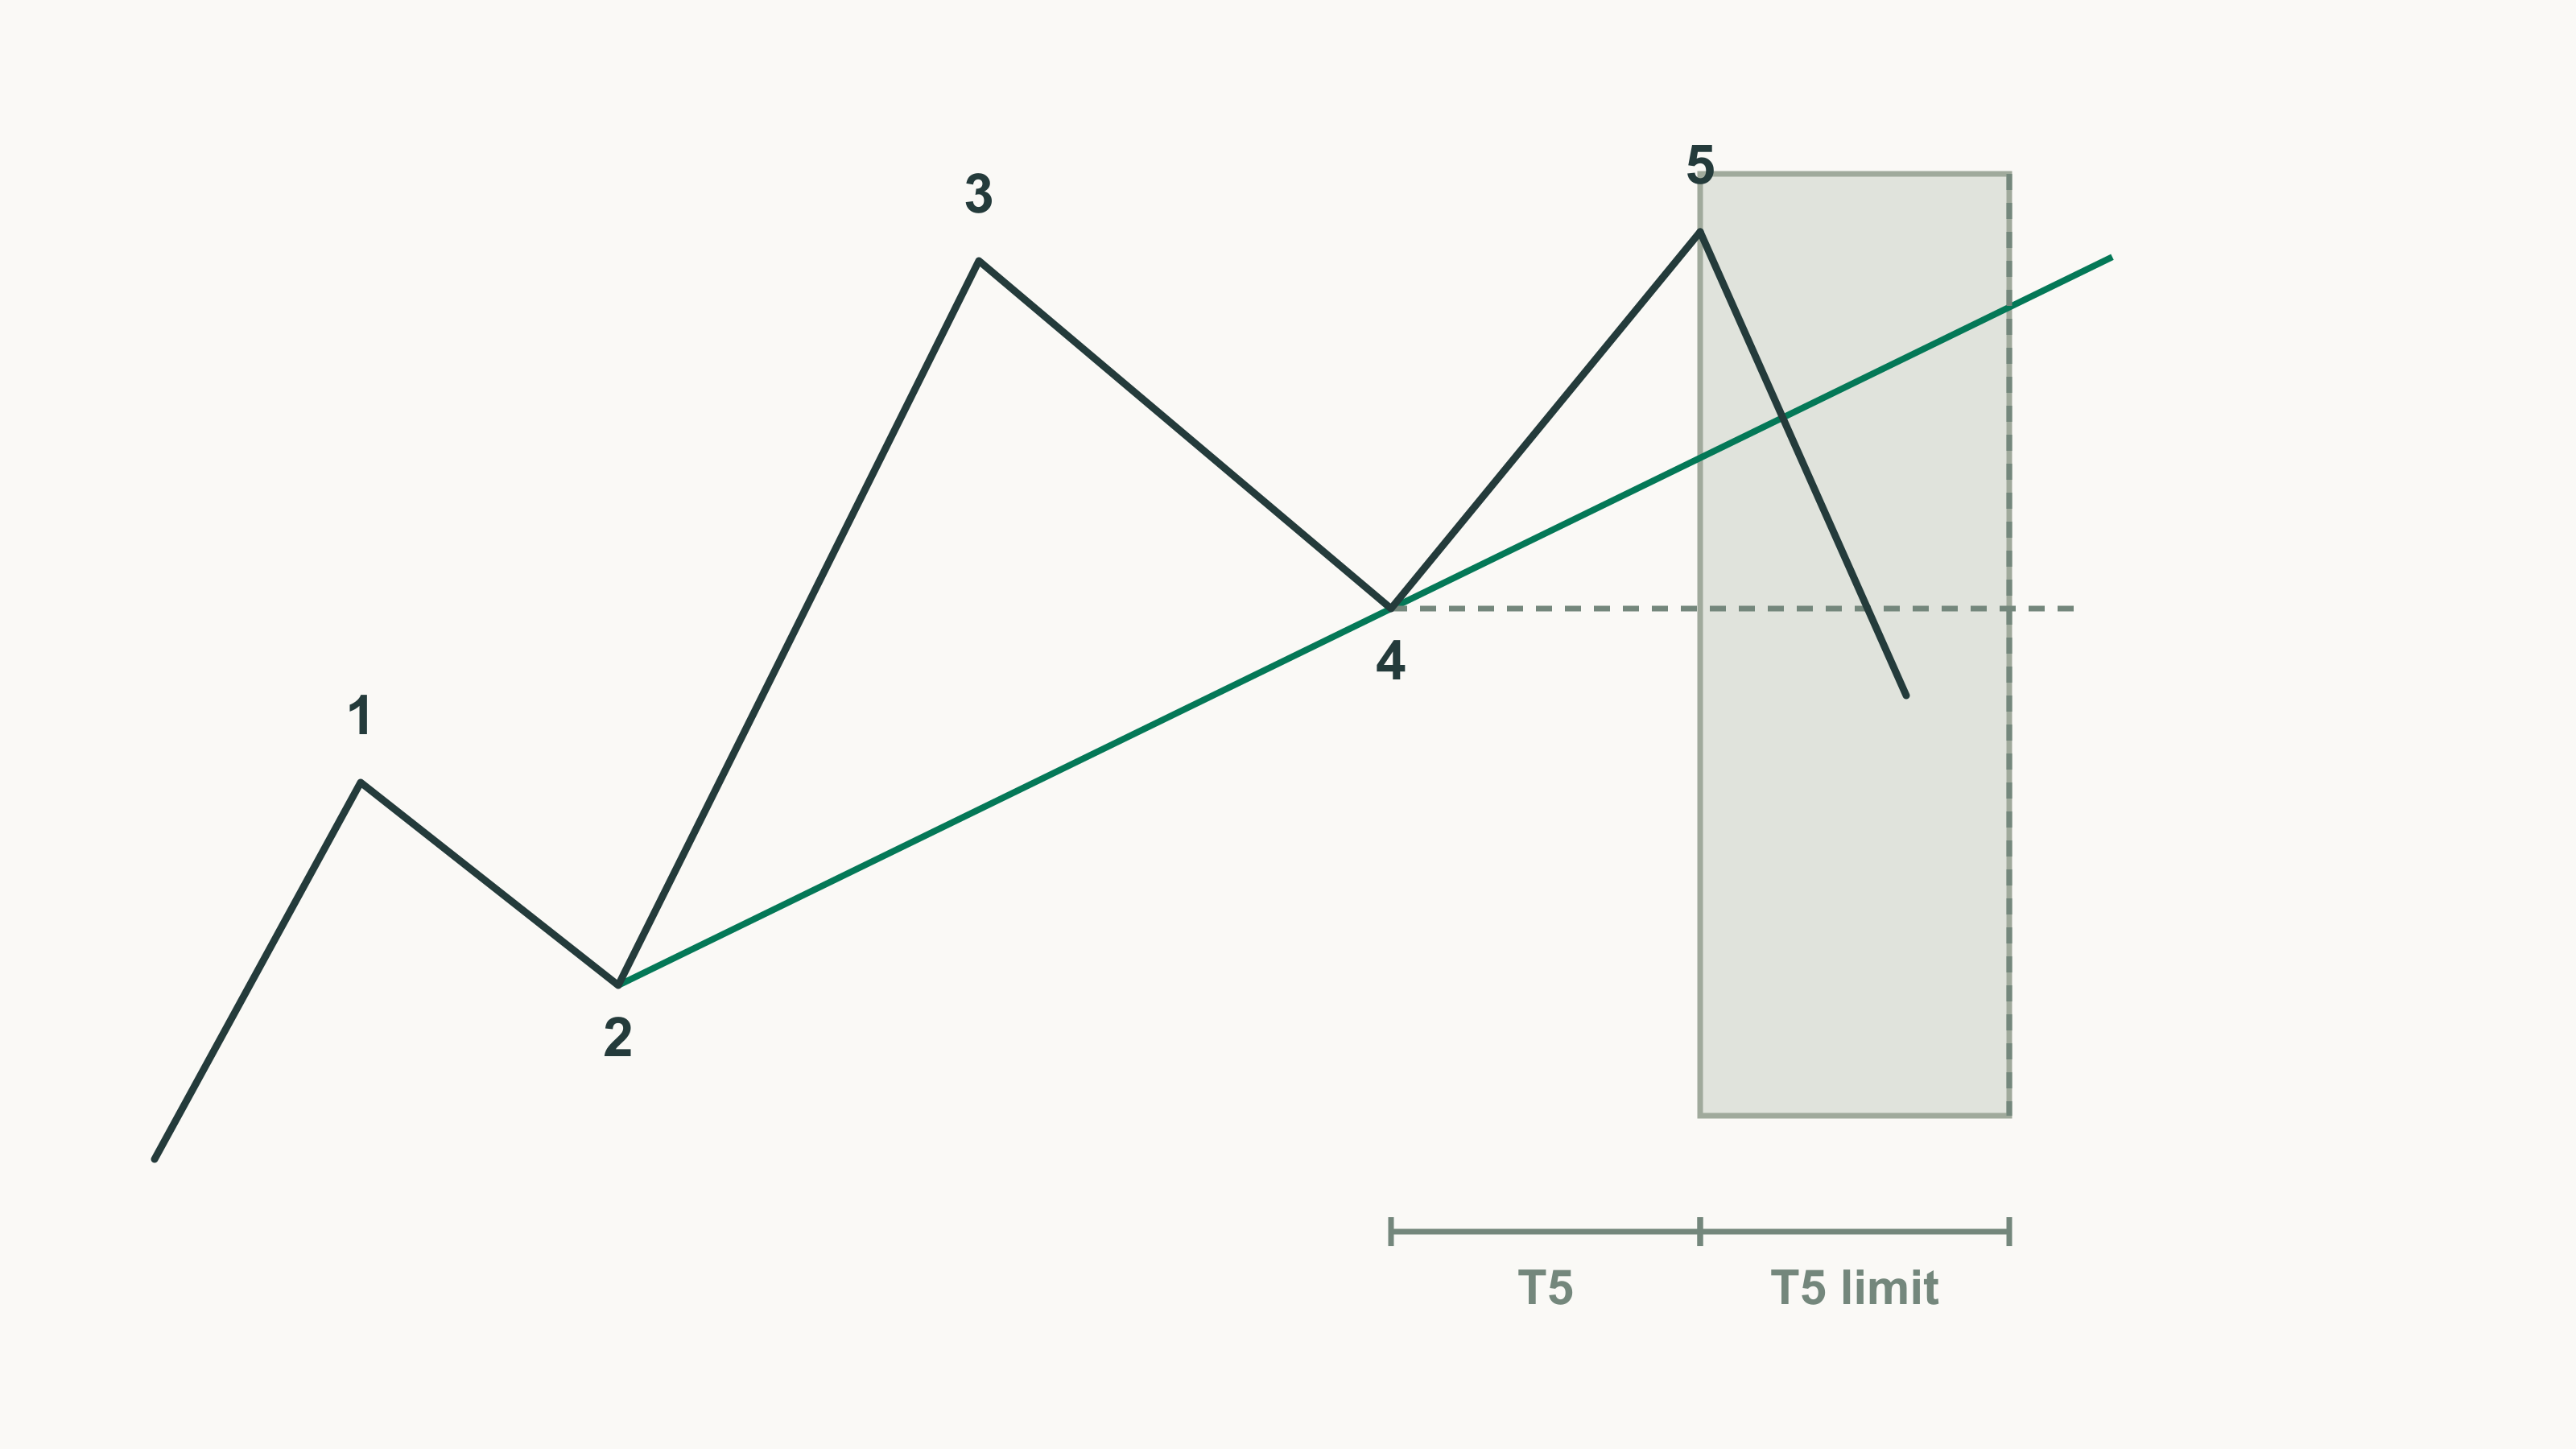
Record the time a pattern looks finished and the time it is confirmed separately, and recalculate the stop and target from the price at the confirmation time.
In Part 7 we identified terminal impulses by their substructure, position and the retracement after they end. Glenn Neely gathered these checks, which test a count against what happens after a pattern ends, into a separate set: the Post-constructive rules of logic. If price doesn't behave the way the pattern implies once you've called it over, he treats the current count as flawed.
Some traders see five waves, call the end and immediately trade the other way. Others say "a wave is over once it retraces about 38.2%." Both boil confirmation down to a single condition.
Neely's confirmation conditions differ by pattern:
- Impulses: the 2-4 line and all of wave 5
- Corrections: the 0-B line and all of wave C
- Triangles: the B-D line
- Terminals: the whole pattern
Each condition comes with a deadline: the formation time, meaning the time the last wave or the whole pattern took to form.
NEoWave doesn't predict where a pattern will end; it confirms the end once the evidence appears. So here we record separately when a pattern looked finished and when it was confirmed.
A standard impulse is confirmed by passing two stages within wave 5's time
When wave 5 appears to end, you can't yet know whether the impulse is over. Price then has to pass two stages.
- Stage 1: extend the 2-4 line joining the ends of waves 2 and 4 to the right, and after the impulse ends price crosses this line in the opposite direction. The time taken must not be longer than wave 5's formation time.
- Stage 2 (2005 Q&A): retrace all of wave 5 in less time than wave 5's formation time, reaching wave 5's starting point.
The sources phrase stage 1's time limit differently: the book says "no more than," the 2005 Q&A "less time than." They disagree only when the time taken exactly equals wave 5's.
If stage 1 takes longer, consider three cases: wave 5 is unfolding as a terminal, wave 4 has not yet ended, or the impulse interpretation is wrong. :L5 (Part 4) is the last impulse (:5) that ends a larger pattern. The minimum confirmation deadline for :L5 adds one step to the formation time, but the stage-1 deadline is wave 5's formation time as is.
Time is counted in steps between wave-chart points; on the daily wave chart, one day is two steps. Take the September–November 2021 advance on the BTC daily wave chart as an impulse candidate, and both stages land within the deadline.
- Candidate: $40,675 on September 24 → $69,000 at 2 p.m. UTC on November 10
- Price rules: wave 3 is 234.8% of the second-longest, wave 5, so it passes the extension rule. The wave-4 end at $57,820 does not overlap the wave-1 end at $44,350.
- Deadline: wave 5 is 26 steps (12.8 days), so up to the daily bar of November 23, the 26th point after the end.
| Stage | Reference price | Time reached (UTC) | Elapsed | vs. wave 5's time |
|---|---|---|---|---|
| Stage 1: 2-4 line break | $65,325 | 8 p.m. on November 10 | 1 step | 4% |
| Stage 2: wave 5's start reached | $57,820 | 3 p.m. on November 18 | 17 steps | 65% |

Our impulse candidates here passed only three price rules (161.8% extension, no overlap between waves 1 and 4, and wave 2 shorter than wave 1). None of the three passes the wave-2 and wave-4 time condition of Part 6, so we use them only to walk through the confirmation procedure. When tracking the two stages, write down the end candidate's time and wave 5's time first, then log what happened, and when, within that deadline.
If only one stage is met, the count is not confirmed
Some traders sell as soon as the 2-4 line breaks, calling the advance over. By Neely's standard, that's only one of the two stages. An impulse count that has met only stage 1 stays in doubt until later price action confirms it.
If an impulse passed every other construction rule, one unmet confirmation condition isn't a reason to restart the count. When the rules don't fit after a 2-4 line break, the most common reason is that wave 4 hasn't ended yet. The April 2026 advance on the BTC 4-hour wave chart is an example that met only stage 1.
- Candidate: $65,000 on March 29 → $79,486 at 1 a.m. UTC on April 27. Wave 3 is 219.1% of wave 5.
- Stage 1: wave 5 was 85 steps (7.0 days), and the 2-4 line ($77,224) broke after 6 steps (14 hours).
- Low after that: $74,938 on April 29, retracing only 78.9% of wave 5.
- New high: before reaching wave 5's start at $73,724, it rose to $79,849 at 1 a.m. on May 4 (84th step), exceeding wave 5's high. On May 6 it rose as far as $82,850.
In this candidate, $79,486 was not confirmed as the end.

Don't commit to a counter-trend position on stage 1 alone. Write down the stage-2 price alongside the end candidate's extreme, and if the extreme breaks first, reconsider where wave 4 or wave 5 sits.
The retracement standard changes with the location of the extension
No single retracement ratio confirms the end of every impulse. The 2005 Q&A defines stage 2 as a full retracement of wave 5, but the book sets different levels depending on which wave extended, with no time limit stated.
- Wave-1 extension: retraces at least to the end of wave 4. If it goes past the end of wave 2, this impulse is seen as having ended a larger pattern.
- Wave-3 extension: retraces into wave 4's price zone and usually stops near the end of wave 4. Retracing 61.8% or more of the whole means a wave one degree larger has ended.
- Wave-5 extension: retraces 61.8% or more of wave 5. If the trend continues, it does not retrace all of wave 5. A full retracement of wave 5 means a larger trend has ended.
- Failed wave 5 (wave 5 shorter than wave 4): must retrace the whole impulse, and if it was an advance, no new high may appear before that.
Two daily wave-3-extension candidates passed both stages, but what followed was different.
- 2024 candidate: $58,946 on October 10 → $104,088 on December 5. Wave 3 is 223.2% of wave 1.
- Two stages: it reached the 2-4 line in 15 hours and wave 5's start at $90,791 in 19 hours. Both were in the first step, 6% of wave 5's 17 steps.
| Candidate | Wave 4's price zone | 61.8% of the whole | Later movement |
|---|---|---|---|
| 2021 | $57,820–67,000 | $51,495 | fell to $42,000, below the 61.8% price, on December 4 |
| 2024 | $90,791–99,588 | $76,190 | after a low of $90,500 (30.1% of the whole), rose to $108,353 on December 17 |
The 2024 candidate dropped into wave 4's price zone, then made a new high without reaching the 61.8% level. The two stages confirm that these five waves ended; whether a larger trend ended is a separate check, using each extension's retracement level. In a wave-5 extension, a full retracement of wave 5 by itself means the larger trend has ended, so we don't apply the 2005 Q&A's stage 2 directly to wave-5 extensions.
For a terminal, the reference price is the start of the whole terminal, not wave 5's start as in a standard impulse's stage 2. The book and a later interview phrase the time standard differently.
- Book: the whole terminal is fully retraced in no more than 50% of its formation time, usually in about 25%. The high or low the terminal made is not exceeded again for at least twice the formation time.
- 2013 interview: it is usually retraced in 25–50% of the formation time. Near 25% is usually a contracting form with the longest wave 1, and near 50% is the case with the longest wave 5.
Both sources put the upper limit at 50%, so this series uses "50% of the formation time or less" as the terminal criterion and treats 25% as a tendency only. If price doesn't get back to the starting point within 50% of the formation time, re-examine the terminal count first.
For corrections, the order of confirmation changes with B/A
Some say a correction is over once price retraces all of wave C after an ABC. For Neely, a full retracement of wave C is only one of two confirmation stages. Flats and zigzags don't require a specific retracement level; confirmation uses these two stages.
- 0-B line break: price crosses the 0-B line joining the start of wave A and the end of wave B.
- Full retracement of wave C: price exceeds wave C's starting point, that is, the end of wave B.
Both stages must occur within wave C's formation time, and their order depends on the price ranges of waves B and A. If wave B is shorter than wave A, the 0-B line breaks first; if longer, the wave-C retracement comes first. If both are met, the correction count stands. If only one is met, the count may still be right, but treat it as a warning and look for other interpretations. In running corrections or irregular failures with a long wave B (Part 9), the time of the second stage can be judged loosely. For complex corrections, check whether the last standard correction ended in the same way.
Take the March–April 2025 decline on the BTC daily wave chart as a correction candidate, and only one stage lands within the deadline.
- Candidate: a decline that began at $95,000 on March 2. Wave A is $18,394 and wave B $12,159, so B/A is 66.1%. Wave B is shorter, so check the 0-B line first.
- Deadline: wave C ended at $74,508 at 7 a.m. UTC on April 7 and took 27 steps (13.7 days).
| Stage | Reference price | Time reached (UTC) | Elapsed | vs. wave C's time |
|---|---|---|---|---|
| Stage 1: 0-B line break | $83,600 | 5 p.m. on April 11 | 9 steps | 33% |
| Stage 2: full retracement of wave C | $88,765 | 1 a.m. on April 22 | 31 steps | 115% |
Stage 2 came 4 steps after the deadline, so treat that as a warning and look for other interpretations.

Also check the size of the move after the end. A running correction must be followed by a move at least 161.8% of the prior wave or wave group. The implications for each pattern are summarized in Part 16.
Triangles are explained in detail in Part 11; here we list only the confirmation conditions.
- Contracting triangle: the B-D line joining the ends of waves B and D is broken within wave e's formation time. The following breakout move (Thrust) must exceed the highest or lowest point inside the triangle and must end within half of the triangle's formation time from the end of wave e. The half-time condition doesn't apply to non-limiting triangles.
- Expanding triangle: confirmed when price after wave e does not fully retrace wave e, or takes longer than wave e's formation time to retrace it.
When a correction meets only one stage, record which stage was missing and how late it came, so you can weigh it against other interpretations.
Recalculate the entry at the confirmation time
Some say waiting for confirmation is too late; others say just enter once it's confirmed. Neither accounts for how far price has already moved by then. By the time stage 2 is confirmed, price has already traveled a full wave 5 from the end candidate. In the 2021 candidate, with $69,000 as the stop reference, the stop distance and the remaining distance differ greatly between the stage-1 time and the stage-2 time.
Below is an example trade plan, separate from Neely's pattern rules. In his rules, 61.8% tells you whether a larger wave has ended; it isn't a price target. This plan uses it only to measure distance.
- Record the end candidate: write down $69,000 at 2 p.m. UTC on November 10, 2021 as the end candidate. Also write down the confirmation deadline set by wave 5's 26 steps (the 26th point after the end, the November 23 daily bar).
- At stage 1: at 8 p.m. on November 10, recalculate from the 2-4 line at $65,325. It is 5.6% to the $69,000 stop and 21.2% to $51,495, a reward-to-risk ratio of 3.76.
- At stage 2: at 3 p.m. on November 18, recalculate from $57,820. It is 19.3% to the stop and 10.9% to $51,495, a ratio of 0.57. If the ratio is below 1.5, do not enter.
- Invalidation: if price exceeds $69,000 before stage 2, drop this plan.
Entering at stage 1 means trading with only one of the two stages confirmed. Entering at stage 2 means confirmation is complete, but the minimum retracement for a wave-3 extension (into wave 4's price zone) has already happened. Don't reuse a plan built on the end candidate's price; recalculate the stop distance and remaining distance at each confirmation point.
A confirmation record contains three times and any moved end candidate
If you record only the end candidate's time, you can't later tell which stage was confirmed when.
- Three times: write down the time of the end candidate's extreme, the stage-1 time and the stage-2 time separately.
- How the times were set: here each time is the first hourly bar that met the condition, and elapsed time is counted in steps up to the first wave-chart point after it. Judging a 2-4 line break by close or by intraday price gives different times, so record which one you used.
- Moved end candidate: if the extreme is exceeded again, as with the April 2026 candidate, move the end candidate to the new extreme. Recalculate the confirmation deadline, stop and target from the new extreme too. How to reread the end of wave 4 with channels is explained in Part 13.
In triangles and terminals the last leg may slightly overshoot Neely's price and time limits, so for these two patterns don't throw out the end candidate over a small excess.