OptiNod Academy
Flats — the correction isn't over just because wave B tops the start of wave A
Neely sorts flats into variations by their B/A and C/B ratios. We measure each variation's wave-C limits and time conditions on real BTC and ETH data.
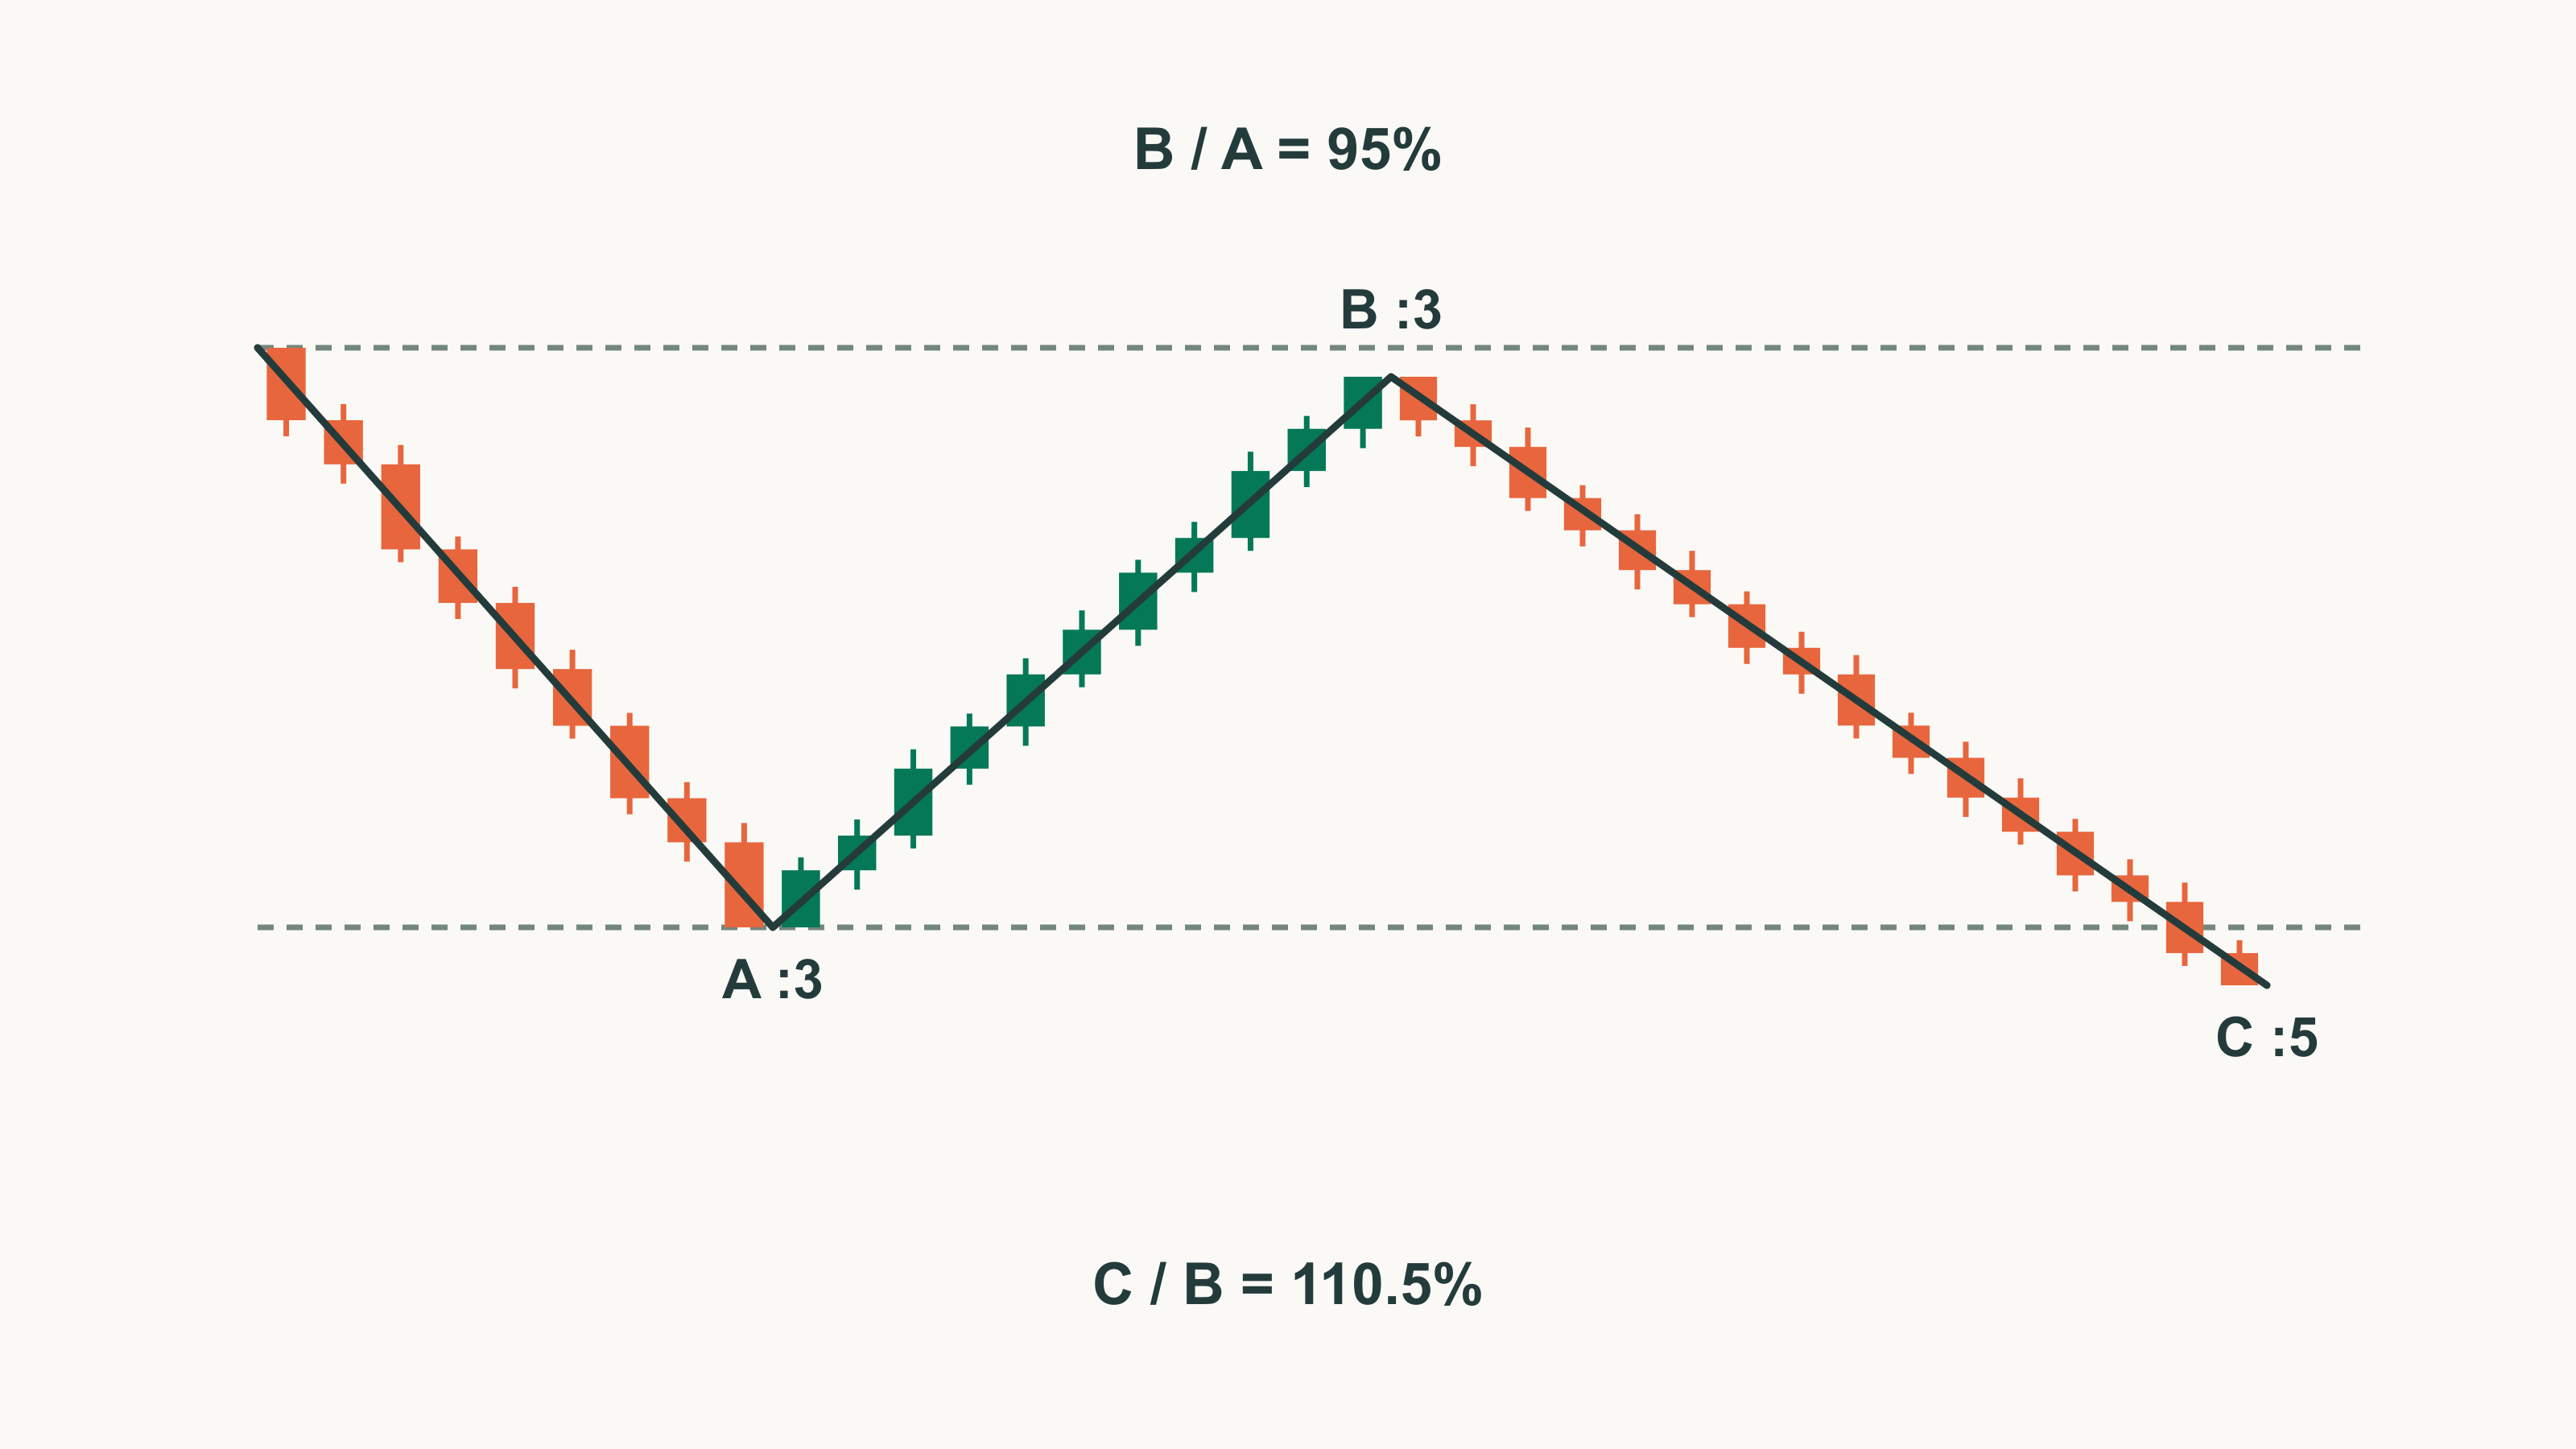
A wave B that tops the start of wave A doesn't end the correction. Identify the variation from the B/A and C/B ratios, then work out wave C's limits.
In Part 8, we kept the moment a pattern looks finished separate from the moment it's confirmed. Now we turn to the flat, one of the corrective patterns. Glenn Neely's flat is a 3-3-5 correction: waves A and B are corrective (:3) and wave C is impulsive (:5). :3 and :5 are the structure labels from Part 4.
A common reading says that once the bounce in a correction (wave B) gets past the start of wave A, the prior high, the correction is over and the trend has resumed. Some writers also describe a flat simply as a range where A, B and C move at the same height. Neely files a wave B that passes the start of wave A under the flat variations as a strong B wave, and holds that the larger B/A gets, the harder it is for wave C to fully retrace wave B.
On October 6, 2025, BTC rose to $126,200, above the August 14 high of $124,474. Four days later, on October 10, it fell to $102,000. Here we treat three-leg moves like this as flat candidates, measure their ratios and time, and see which variation each one is and where it fails.

Wave B must retrace at least 61.8% of wave A to make a flat candidate
A wave B that retraces 61.8% or more of wave A isn't enough to count a flat. The wave-C condition and the structure have to fit as well.
- Wave B: its price range is at least 61.8% of wave A's price range. Below 61.8%, it's no longer a flat candidate; zigzags are covered in Part 10.
- Wave C: its price range is at least 38.2% of wave A.
- Structure: waves A and B are :3, wave C is :5.
Take BTC in March 2024 as a falling flat candidate. Wave A starts at $73,777 at 7 AM UTC on March 14. Wave B got past $68,810, the 61.8% retracement of wave A, so the first condition is met.
| Leg | End | Price range | vs. wave A | Monowaves | Point spacing | Actual time (1-hour bars) |
|---|---|---|---|---|---|---|
| A | March 20, 5 AM, $60,775 | $13,002 | base | 9 | 12 steps | 5.9 days |
| B | April 8, $72,798 | $12,023 | 92.5% | 29 | 39 steps | 19.3 days |
| C | April 19, $59,600 | $13,198 | 101.5% | 13 | 21 steps | 10.6 days |
Time is counted in point spacing on the wave chart. A daily wave chart has two points per bar, so one day is two steps. Our measuring tool doesn't decide whether a leg is internally :3 or :5, so sections that meet the ratios are logged only as flat candidates. Part 15 counts the same March 14 to April 19 section as a seven-leg diametric candidate.
Variations split first by the B/A range
To identify a flat's variation, draw horizontal lines at wave A's high and low, then look first at where wave B ended.
- Weak B wave (61.8% to under 81%): C/B under 100% is a double failure, 100–138.2% is a B-failure, and over 138.2% is elongated.
- Normal B wave (81–100%): C/B under 100% is a C-failure, 100–138.2% is a common flat, and over 138.2% is elongated.
- Strong B wave (over 100%): wave B passed the start of wave A. The variations are irregular, irregular failure, running and elongated.
Even the book isn't fully consistent on the boundaries. Chapter 5 gives the weak B wave as 61.8–80% and the normal B wave as 81–100%, while chapter 11 gives the B-failure as 61.8–81%. We follow the more conservative chapter 11 boundary: wave B under 81% is weak, and 81% or more is normal.
The March–April 2024 candidate has a B/A of 92.5%, a normal B wave, and a C/B of 109.8%, which puts it in the common flat range. In a common flat, wave C goes slightly past the end of wave A, by no more than 10–20%. The book doesn't say 10–20% of what, so we measure against wave A's range. Wave C went $1,175 below the end of wave A, or 9.0% of wave A. If you set a wave-C target without measuring B/A first, you won't know which ratio table applies.
With a strong B wave, check whether wave C enters wave A's range
With a strong B wave, the chance that wave C fully retraces wave B depends on B/A.
- B/A 101–123.6%: wave C is very likely to retrace all of wave B. If it does and C/A is 161.8% or less, it's irregular; over 161.8% is elongated.
- B/A over 123.6%: wave C is very unlikely to retrace all of wave B.
- B/A over 138.2%: a flat's wave C cannot retrace all of wave B.
In the classification above, the irregular is a flat variation. But chapter 10 of the book, on power ratings, treats the irregular as a contradiction inside a flat and accepts it only as part of a terminal or a triangle. The reason: wave B showed strength by passing the start of wave A, and wave C wipes that out by retracing all of wave B.
When wave C doesn't retrace all of wave B, the variation depends on where wave C ends.
- Irregular failure: wave C enters, even partly, the space between wave A's two horizontal lines.
- Running: wave C does not enter that range at all. Wave B is by far the longest, and waves A and C are similar in price and time. The move after a running correction must be faster than the move of the same degree before it, and must be the longest part of the completed pattern.
BTC in January–February 2022, taken as a flat candidate, meets the irregular failure conditions.
- Wave A: January 13 $44,500 → January 24 $32,917
- Wave B: up to $45,821 on February 10, B/A 111.4%
- Wave C: down to $34,322 on February 24, C/B 89.1%
- Waves A and C: wave C's $11,499 is almost the same as wave A's $11,583 (C/A 99.3%), and the time is similar too, 27 steps for C and 22 for A.
Wave C did not get down to wave B's start at $32,917, but its end is inside wave A's range ($32,917–$44,500), so it isn't a running correction. In an irregular failure, wave C is usually equal to wave A in price and time, or related to it by a Fibonacci ratio. Here it's nearly equal in price and similar in time. On March 28, price passed wave B's high of $45,821 and rose to $48,190.
This candidate doesn't quite match what Neely's description leads you to expect, though. A B/A of 111.4% sits in the 101–123.6% range, where wave C is very likely to retrace all of wave B; whereas irregular failures become very likely when B/A is over 138.2%.

A wave B above the start of wave A doesn't mean the trend has resumed. Measure B/A first and check whether wave C can still retrace all of wave B from there.
Wave C's limits come from the book and later Q&As together
A popular method sets wave C's target at 1.618 times wave A. Under the standard Neely added in official Q&As after the book, though, 161.8% is the upper limit for a common flat's wave C.
- 2007 Q&A: in a common flat, wave C is not allowed to exceed 161.8% of wave A; from 161.8% on is elongated territory. An elongated flat's wave C maxes out around 261.8% of wave A. An elongated flat is accepted only as one leg of a larger triangle, diametric or symmetrical, or as one stage of a complex correction.
- 2021 Q&A: in flats and zigzags, wave C's price is at most about 161.8% of the larger of waves A and B, and its time is at most the sum of waves A and B. Triangles and terminals are the exceptions.
ETH from December 2025 to February 2026 is in elongated territory by C/A.
- Wave A: $3,447.44 → $2,775.19
- Wave B: up to $3,402.89, B/A 93.4%
- Wave C: down to $1,747.80 on February 6, 2026, C/B 263.7%, C/A 246.2%
| Standard | Limit price | C low $1,747.80 |
|---|---|---|
| 2021 Q&A common limit | $2,315.19 | Beyond the limit |
| 2007 Q&A elongated maximum | $1,642.94 | Within the maximum |
An elongated flat's wave C must be larger than waves A and B in both price and time. This wave C is 45 steps, shorter than wave B's 54. To keep calling the section an elongated flat, you'd have to recheck the time relationship and find grounds for a larger triangle or complex correction (Part 11, Part 12). Part 10 puts the same section as a wave-A candidate of a larger zigzag. As a flat, the whole section must be :3; as a zigzag's wave A, :5. Keep both counts until you've checked the internal structure.
BTC from March to June 2026 fails the B/A condition. Wave A goes from $76,000 to $65,000 and wave B to $82,850, so B/A is 162.3%. Wave C fell to $59,131 on June 5 and retraced all of wave B (C/B 132.9%). Wave C's $23,719 range is within the 2021 limit range of $28,881. But a flat's wave C cannot retrace all of wave B when B/A is over 138.2%. As wave c of a triangle, it can.

Wave B can't finish in less time than wave A
Some candidates fit every price ratio and still fail on time. In a 2008 Q&A, Neely said his time analysis had become more refined since the book and set out the time relationships for flats and zigzags.
- Wave B: cannot finish in less time than wave A.
- Wave C: if waves A and B took similar time, it's usually the two combined; if wave B is much longer, it's half of the two combined. So wave C always takes longer than wave A.
We measure these time relationships in point spacing as well. BTC from March to August 2024 fails on wave B's time.
- Turning points: March 14 $73,777 → May 1 $56,553 (A) → June 7 $71,997 (B) → August 5 $49,000 (C)
- Verdict: B/A 89.7% passes the price condition. Wave A is 97 steps and wave B 73, so wave B is shorter.
The August–October 2025 BTC move from earlier fails on wave C's time.
- Turning points: $124,474 → $107,255 (A) → $126,200 (B) → $102,000 (C)
- Price: B/A 110.0%, C/B 127.7%, C/A 140.5%, in the irregular range. Wave C's $24,200 range is within the 2021 limit range of $30,652.
- Time: wave C is 8 steps, shorter than wave A's 36.
Price then fell to $80,600 on November 21. If a candidate fails the time relationship, don't buy on the flat count, however well the ratios fit.
A trade plan for a flat candidate starts from wave C's limits
A common approach is to put the stop just below the low once wave C looks finished. With a flat candidate, you can work out wave C's price and time limits in advance instead.
Below is an example trade plan for the March–April 2024 BTC candidate. It is separate from Neely's pattern rules.
- Candidate conditions: B/A of at least 61.8%, and wave B's time at least wave A's. Here, B/A is 92.5%, wave B 39 steps and wave A 12.
- Calculate the limits: wave C's price limit is $51,761, wave B's end minus 161.8% of the larger of A and B. The time limit is the point 51 steps (A+B) after wave B's end, 2 AM UTC on May 4. Measured in actual time, it's 5 PM on May 3, a 9-hour difference.
- Entry: buy when wave C goes below wave A's end of $60,775 and then closes back above it on a 1-hour bar. That was $61,785 at 3 AM on April 19.
- Stop: place it below the $51,761 price limit, 16.22% from the entry. A stop below the wave-C low of $59,600 (3.54% away) would have been hit on the way down to $56,553 on May 1.
- Invalidation: if a new low appears after the 2 AM May 4 point, don't treat this section as a flat.
Remeasured with the decline through May 1 as wave C, C/B is 135.1% and wave C is 46 steps, still within the common flat conditions and the time limit. Wave C's low can keep moving while it's in progress, so put the stop at the limit price and size the position down to fit that distance. The June 7 high that followed was $71,997, 16.53% above the entry.
Confirm the flat with internal structure and the 0-B line
Once the ratios and time all fit, check two more things.
- Internal structure: in an irregular failure, if wave C is :3, an expanding triangle or a contracting triangle with a large wave c may be in progress. In an irregular, wave B must subdivide more finely than wave A. Check structure separately with the structure labels from Part 4.
- The 0-B line: connect wave A's start and wave B's end. If price crosses this line, wave C and the larger pattern have likely ended.
Part 8 covers the order for confirming that a pattern has ended, and Part 13 covers channel rules. We log a flat as finished only when the ratios and time all fit and both of Part 8's stages (breaking the 0-B line and retracing all of wave C) happen within wave C's formation time. Until then, it's only a candidate.