OptiNod Academy
Power Ratings — Turning a pattern name into an expected size for the next move
Neely gave each corrective pattern a rating from -3 to +3 and set a retracement limit for the next wave. We test moves that broke those expectations on real BTC and ETH data and recheck the counts.
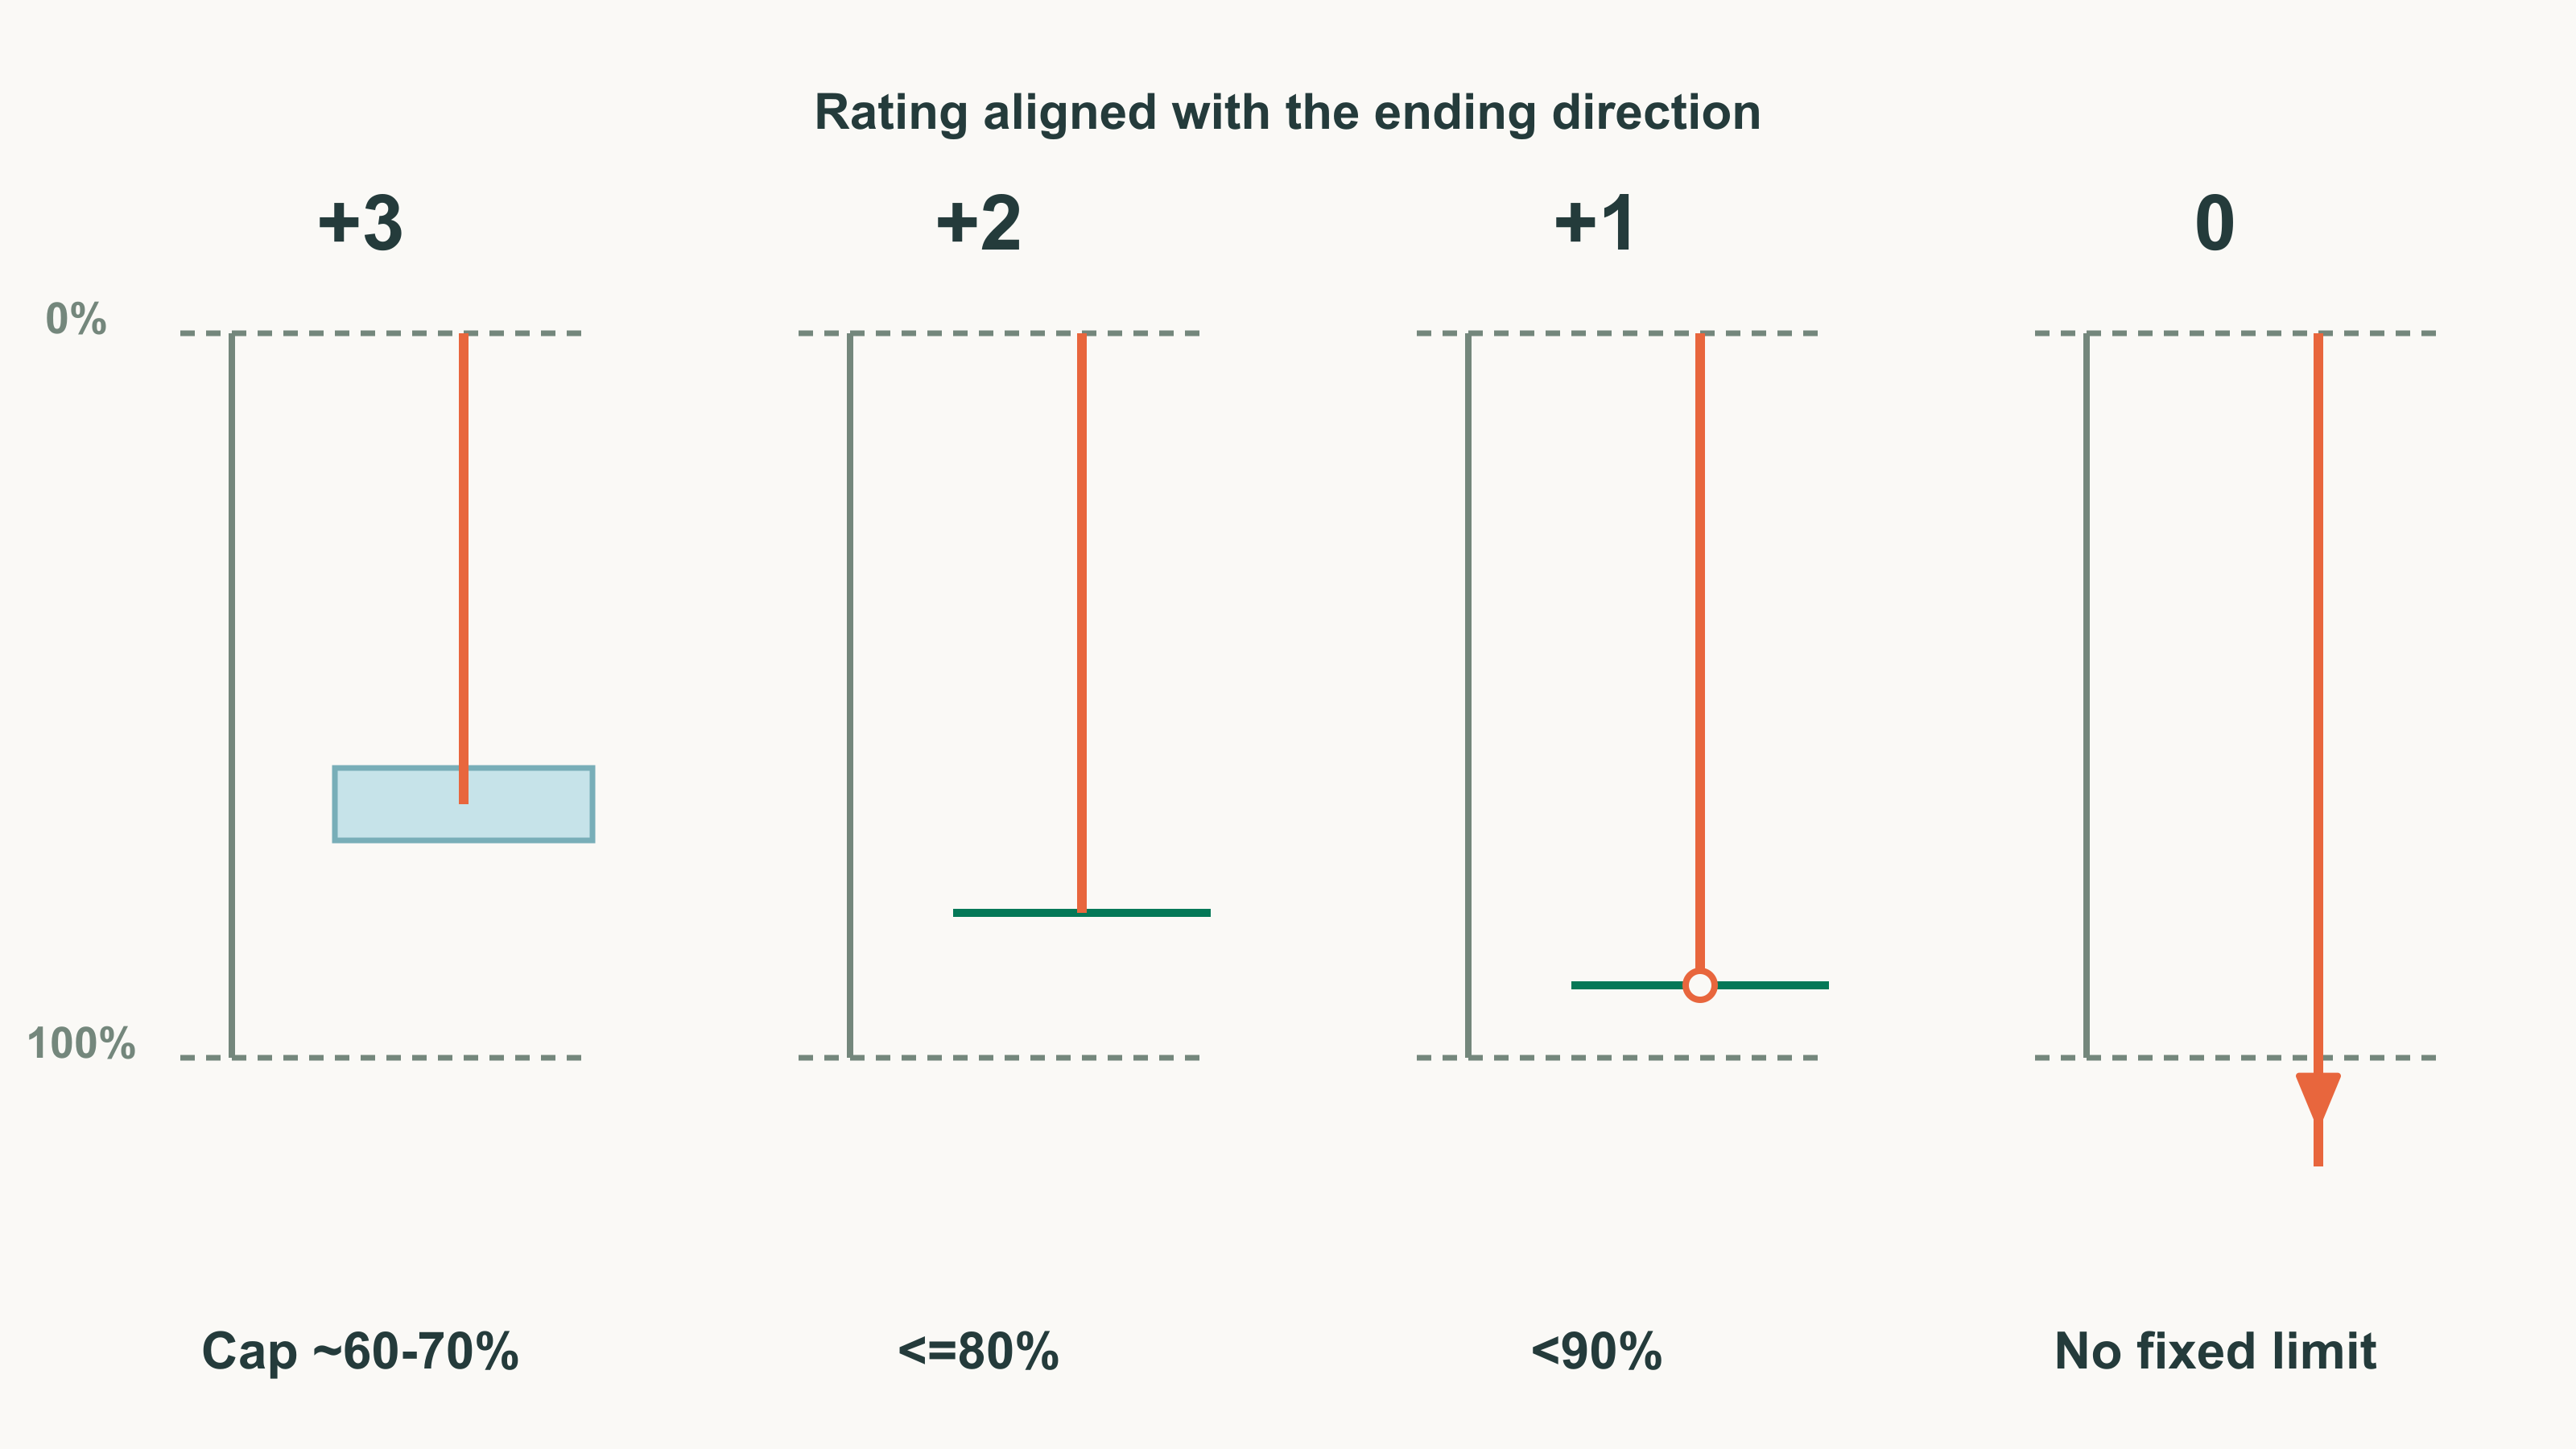
Turn a pattern name into an expected size for the next move, and if the market moves differently, suspect the count again.
In Part 15, we told seven- and nine-leg sideways ranges apart by the symmetry of leg size and time. Until now we've mostly covered rules for identifying patterns. Here we look at what comes next: how big the following move should be, given the pattern's name.
In Elliott Wave analysis, it's easy to think the job is done once the pattern has a name. After a correction ends, traders tend to read a deep retracement as strength on the other side and a shallow one as the trend continuing. Glenn Neely held that the same depth means different things depending on which pattern just ended. So he gave each corrective pattern a Power Rating from -3 to +3 and set, for each rating, a limit on how much the next wave can retrace.
In May 2024, after a normal flat candidate ended, BTC retraced 89.7% of the pattern. With the normal flat's rating of 0, that's no problem. Had the same spot been labeled a double flat (±2), it would have broken the 80% limit and the count would need another look. We make this kind of comparison on four real segments.
A Power Rating is a grade from -3 to +3 given to each corrective pattern
A rating isn't a return or a probability. Neely's Power Ratings table grades 19 corrective patterns, triangles excluded. A plus sign means force that helps the market rise; a minus sign means force that holds a rise back. A pattern's sign flips depending on whether its last wave ended up or down. The table lists ratings for patterns ending with a rise; for a pattern ending with a fall, flip every sign.
| Group | Pattern | Ended with a rise |
|---|---|---|
| Complex correction | Triple zigzag, triple combination, triple flat | +3 |
| Complex correction | Double zigzag, double combination, double flat | +2 |
| Elongated | Elongated zigzag, elongated flat | +1 (0 inside a triangle) |
| Neutral | Zigzag, B-failure, common flat | 0 |
| Opposite direction | C-failure, irregular | -1 (0 inside a triangle) |
| Opposite direction | Irregular failure, double three, triple three | -2 (irregular failure is 0 inside a triangle) |
| Opposite direction | Running, double running, triple running | -3 |
The top eight patterns share their rating's sign with the direction they ended in; the bottom eight have the opposite sign. That's why a running pattern ending with a fall is +3: the correction ended down, but the running shape signals strong upward force.
There's a condition on using ratings: apply them only after every pattern in progress has been compacted and you've reached the largest one. Compaction reduces a completed pattern to a single :5 or :3 symbol (Part 5). If a double zigzag is the last part of a larger terminal impulse, ignore the double zigzag's rating and look only at the move the terminal requires. Don't rush to rate a small flat you happen to spot on the daily chart.
Patterns whose sign matches their ending direction get retraced less as the rating grows
Don't use these retracement limits as reversal targets. The ratio divides the price range of the next completed wave of the same degree by the full price range of the corrective pattern that ended.
- 0: implies no particular ratio. Anything from 0% to more than 100% retracement is possible.
- ±1: the next wave cannot retrace 90% or more.
- ±2: it can retrace only 80% or less.
- ±3: it is retraced the least, around 60–70%.
Just before listing these limits, Neely wrote that +1 to +3 patterns ending with a rise must not be fully retraced by the next wave. The list itself doesn't repeat that direction condition. Following the earlier sentence, we apply the limits only when the sign matches the ending direction, as with the top eight patterns in the table.
Take BTC from March to May 2024 as a normal flat candidate.
- A, B, C: Mar 14, $73,777 → Mar 20, $60,775 → Apr 8, $72,798 → May 1, $56,553
- Ratios: B/A 92.5%, C/B 135.1%, within the normal flat range of Part 9.
- Whole pattern: $17,224, 48 daily bars
- Next rise: stopped at $71,997 on June 7 after retracing 89.7%, then fell below the end of C to $53,486 on July 5.
Part 15 also measured the same March–April segment as a seven-leg diametric candidate. With a rating of 0, an 89.7% retracement tells us nothing either way. Reading this rise as an X wave, as in Part 12, doesn't conflict with a rating of 0 either.

Patterns with the opposite sign come with requirements for the next move
Instead of a limit, the bottom patterns in the table come with requirements for the next move or conditions on where they can appear.
- C-failure: must be fully retraced by the next wave of the same degree. If it ends a correction, the next impulse must be larger than the previous impulse in the same direction.
- Irregular failure: must be fully retraced, and the next impulse is usually 1.618 times the previous impulse.
- Double three, triple three: the next impulse must be at least 161.8% and at least 261.8% of the previous impulse, respectively.
- Running: the next impulse must be at least 161.8% of the previous impulse.
- Irregular: wave B shows strength by going past the start of wave A, and then wave C cancels it by moving longer than wave B. That doesn't add up as a standalone flat, so it's acceptable only inside a terminal or a triangle.
You can't measure these multiples until you've fixed the degree of the previous impulse.
The BTC irregular failure candidate of January–February 2022 met the requirement of being fully retraced.
- A, B, C: Jan 13, $44,500 → Jan 24, $32,917 → Feb 10, $45,821 → Feb 24, $34,322
- Ratios and rating: B/A 111.4%, C/B 89.1%. It is an irregular failure that ended with a fall, so its rating is +2.
- Whole pattern: $10,178, 42 daily bars
- Full retracement: at 12:00 UTC on March 1, five days after the end of C, the price crossed the $44,500 start, and that day's high was $44,949. That is 11.9% of the time the pattern took to form.
- Afterward: it crossed the end of B at $45,821 on March 27 and rose to $48,190 on March 28, 136.3% of the pattern.

A strong pattern ending in the same direction is not fully retraced by the next wave
ETH's decline from December 2025 to February 2026 is an elongated flat candidate. An elongated flat ending with a fall rates -1, so the next rise must not reach the 90% retracement level.
- A, B, C: Dec 10, $3,447.44 → Dec 18, $2,775.19 → Jan 14, $3,402.89 → Feb 6, $1,747.80; C/A 246.2%
- 90% limit: $3,277.48, a 90% retracement of the $1,699.64 pattern range
- Next rise: stopped at $2,464.91 on April 17, at 42.2%. The highest price through the October 21 bar was $2,807.34 on September 21, at 62.3%.
This candidate has already failed two flat conditions. In Part 9 it exceeded the 2021 wave-C limit ($2,315.19), and it also failed the time condition because wave C, at 23 daily bars, was shorter than wave B at 27. Neely accepts an elongated flat only as one leg of a larger pattern, and Part 10 counted the same segment as a wave-A candidate of a larger zigzag. So the numbers above are practice in measuring a rating limit; they don't settle this pattern's rating.
The limit held, but we still don't take the candidate at face value. On June 4 price fell below the end of C at $1,747.80, reaching $1,505.68 on June 6, so wave C may not have ended on February 6. Neely sees elongated flats as usually appearing inside triangles, so if this is one leg of a larger triangle, look at what the triangle implies rather than at this pattern's rating. A limit that holds is only a reason not to discard the count, not proof that it's right.

When the market moves differently than expected, recheck the count first
When an expectation proves wrong, it's easy to take the stop and move on. Neely holds that if the move after a pattern doesn't take the shape the pattern implied, the interpretation has a significant error. Terminal impulses are an example: a terminal must be fully retraced within 50% of its formation time, and if it isn't, there was no terminal there (Part 7). When a move breaks expectations, recheck in this order.
- Compaction level: check whether the rated pattern is the last part of a larger pattern. If so, switch to the larger pattern's rating and measure again.
- Triangle or terminal: if a pattern rated ±1 to ±3 is fully retraced by a pattern of the same complexity with a rating closer to 0, that signals a triangle or terminal is forming. Inside those two patterns, one wave's implications don't carry over to the next.
- Pattern name: if neither applies, redo the pattern identification from scratch.
BTC from August to October 2025 needs exactly this sequence.
- A, B, C: Aug 14, $124,474 → Sep 1, $107,255 → Oct 6, $126,200 → Oct 10, $102,000
- Ratios: B/A 110.0%, C/B 127.7%, C/A 140.5%
- Next move: stopped at $116,400 on October 27, at 64.1% of the pattern. On November 4, 25 days after the end of C, it fell below $102,000 and went as low as $80,600 on November 21.
On price ratios alone, it's an irregular flat ending with a fall (+1, upward force). But as Part 9 showed, wave C at 4 daily bars is shorter than wave A at 18, so the count fails the time condition. The numbers above test whether the next move matched the rating if we keep the +1 anyway. The next rise stopped at 64.1% and price then fell below the end of C, which doesn't fit the upward force +1 implies. An irregular doesn't add up as a standalone flat, so drop the flat count here and check whether the segment belongs to a triangle, a terminal or a larger decline.
The book also gives breakout multiples for each triangle variation, but in a 2007 official Q&A Neely revised the breakout from a triangle in the wave-B or wave-4 position to about 161.8% of the longest leg. See Part 11 for details.
Ratings set the stop and the target together
Below is an example trading plan, separate from Neely's pattern identification rules. For the 2022 BTC irregular failure candidate (+2), it turns the requirement "must be fully retraced" into a target.
- Candidate conditions: an irregular failure candidate that ended with a fall, with B/A 111.4% and C/B 89.1%. There is no evidence that this pattern is the last part of a larger pattern.
- Entry: buy when a 1-hour close crosses $38,715, the 38.2% retracement of wave C. That was the $38,800 close at 02:00 UTC on February 25, 0.9 days after the end of C.
- Stop: below the end of C at $34,322, which is 11.5% below the entry price.
- Target: the pattern start at $44,500, 14.7% above the entry price. The reward-to-risk ratio is 1.27.
- Time limit: if price hasn't reached the start within the 42 daily bars the pattern took to form, exit at the April 7 close.
This candidate hit the target on the 1-hour bar at 12:00 UTC on March 1. The low before that was $37,000, so the stop held, and the gain before costs was 14.7%. That's one segment and says nothing about a win rate. At entry you can't know whether wave C has ended, so if price falls below the end of C, drop the rating too.
Use ratings after confirming the end of the next wave and the pattern identification
- End of the next wave: the retracement limit applies to the next wave of the same degree to complete. Here we used the maximum retracement before price crossed the end of C again as a stand-in for that wave, without judging degree or compaction. Check structure labels and degree separately with the methods of Part 4 and Part 5.
- Pattern identification: the ratings mean something only if the pattern name is right, and the name is settled only after ratios, time, structure and the post-pattern confirmation of Part 8.
We found no official revision of the Power Ratings table itself, so the ratings and limits follow the 1990 book. When you record a pattern, note its rating and the retracement limit that rating allows. Then, the moment the next move breaks the limit, you'll know which count to recheck.